What does this tell us? That we're on the verge of a two-standard deviation shift from the historical average. From a simple question of mathematics, this is VERY significant.
But will the market care right now? It appears not. We hear a lot of chatter about what is frothy.
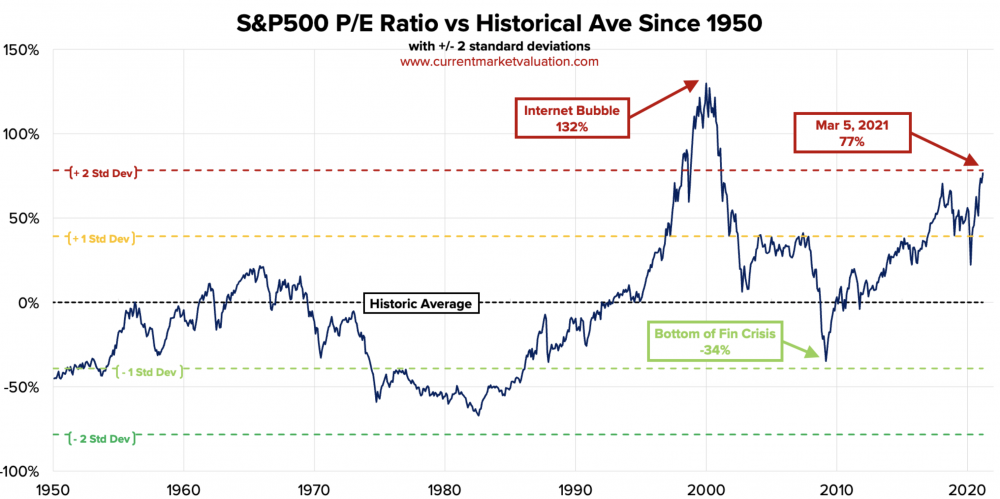
The answer is everything. But as you can see, the Internet Bubble of 2000 brought about a 132% difference between the S&P 500 P/E Ratio and the historical average to 1950. And… it came over a three-year period.
With momentum flipping positive again on Tuesday for the first time in weeks, institutional capital is coming back after this massive tech dip. While mega caps were impacted by the selloff, the real momentum will be found in the smaller and medium cap stocks.
And, with more stimulus money coming into the market in the coming weeks, we could see that S&P500 P/E ratio move toward the 90% level. Even then, keep in mind that even at very frothy levels, a bubble can last much longer than short sellers can remain solvent (to modify the views of John Maynard Keynes).
If you're a bit more conservative with your approach and the thought of investing in stocks that have increased more than 100%, 200%, (or even more than 800% like Tesla) in the last year, I have a very simple strategy for you to follow. I call it – The Poor Man's Momentum Strategy.
Tomorrow, I'll explain how it works, how you can make money with it, and give you a list of companies that you can trade and the numbers you need to do this successful, market-beating strategy by yourself.
Enjoy your Wednesday,
| 


Post a Comment
Post a Comment