Most Americans don't understand how the housing market works... For example, personal-finance website NerdWallet recently released the results of a survey of potential homebuyers.
28 Million Americans Plan to Get a $100,000 Discount
By Marc Chaikin, founder, Chaikin Analytics
Most Americans don't understand how the housing market works...
For example, personal-finance website NerdWallet recently released the results of a survey of potential homebuyers. It showed that many folks think we're in uncharted territory...
Two-thirds of the more than 2,000 survey respondents said they expect an imminent crash. And more than 60% of those folks believe current mortgage rates are "unprecedented."
That's far from the case, though...
In fact, the low mortgage rates in 2020 and 2021 were actually more extraordinary. Data from mortgage-loan company Freddie Mac shows that 30-year fixed-rate mortgages have averaged about 7.8% over the past 50 years. Meanwhile, the current rate is around 6%.
So it's clear from the start that many people are misinformed. And it gets worse...
Learn how to claim one free year of the trading system that Dr. Steve Sjuggerud calls "the Swiss army knife of research systems" ($1,188 value), which booked an AVERAGE annualized gain of 40% in 2022! Plus, see where cash is going - BEFORE it gets there - for the chance to "5X"to"10X" your money multiple times as it all plays out. By midnight, click here for full details from Steve. (Includes two free stock recommendations.)
While everyone's worried about inflation, cryptocurrencies, and a looming recession, professor and forensic accountant Joel Litman just delivered an even more surprising warning when he met with top military brass at the Pentagon recently. Here's what Joel says will happen to the market over the next 90 days.
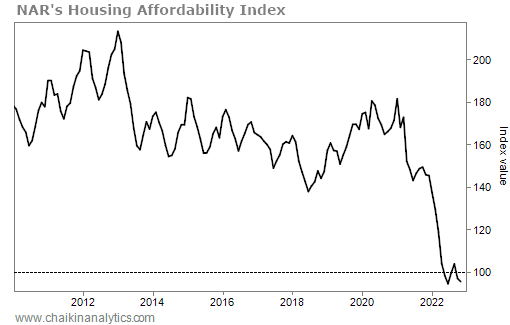
Every month, the National Association of Realtors ("NAR") publishes a Housing Affordability Index.
This index measures whether the typical American family makes enough money to qualify for a standard mortgage on a median-priced home. It assumes a 20% down payment, a 30-year fixed-rate mortgage, and that debt service won't exceed 25% of income.
An index value of 100 means the median family's income matches exactly what's needed to qualify for a mortgage. Higher readings mean folks can better afford it. And lower readings mean housing is unaffordable.
NAR's Housing Affordability Index fell below 100 last May for the first time since June 1990. And as you can see in the following chart, it has mostly stayed below that level since then.
Here's the index from early 2010 through this past November...
Put simply, most Americans can't afford to buy a home today.
It's tempting for casual observers to simply blame the Federal Reserve...
After all, even if mortgage rates aren't at "unprecedented" levels, they have surged since the Fed started raising interest rates. And that does make buying a home more expensive.
But many prospective buyers are missing the real problem with the housing market...
You see, the "sticker prices" on homes have also risen faster than the Consumer Price Index ("CPI"). And by extension, they've risen faster than many folks' disposable incomes.
In November, NAR's Housing Affordability Index fell to 95.5. That's unacceptably low. And we need to consider an important point about that calculation...
It assumes a $376,700 median price and a roughly 6.8% mortgage rate.
If sticker-price growth would've matched the growth in disposable incomes from December 2019 through this past November, the median price on a single-family home would've only been about $280,000. And NAR's Housing Affordability Index would've been at 130.
If sticker-price growth would've matched CPI growth over that same period, the median price on a home would've been around $296,200. And NAR's Housing Affordability Index would've been at 123.
It's clear that home prices are soaring. This problem is much bigger than higher interest rates. And once again, most Americans just don't understand how everything works...
According to the NerdWallet survey, 28 million Americans plan to buy a home this year. And they hope to spend an average of $269,200.
At that sticker price, NAR's Housing Affordability Index would be even higher.
But to put it bluntly... that's a fantasy.
It's more than $100,000 below the current median home price. And according to Fed data, home prices crossed this fantasyland level roughly a decade ago.
Folks, there's no getting around it... We need more housing supply.
And the Power Gauge recognizes the opportunity in front of us...
The entire homebuilding industry currently earns a "very bullish" grade. No kidding.
American consumers still want to buy homes. They're struggling because of high interest rates and high prices. But supply can – and eventually will – alleviate the sticker-price pain.
And that's why the Power Gauge remains optimistic about the housing market today.
Good investing,
Marc Chaikin
P.S. I recently shared an ideal way to play this trend with my Power Gauge Investor subscribers...
In short, it's a "picks and shovels" type of opportunity. This company will benefit as homebuilders increase their supply to meet existing demand in the months ahead.
The Power Gauge rates the company's stock as "very bullish" today. I believe its share price could easily surge 50% in 2023. And if all goes well, it could double by the end of next year.
If you want to know all the specifics, you're in luck...
I've put together a special offer for all Chaikin PowerFeed readers. It includes a free bonus year of Power Gauge Investor.Click here for all the details.
Market View
Major Indexes and Notable Sectors
# Hld: Bullish Neutral Bearish
Dow 30
+0.88%
9
16
5
S&P 500
+1.29%
170
269
61
Nasdaq
+2.07%
39
49
12
Small Caps
+0.72%
610
1021
258
Bonds
-0.80%
Energy
+3.20%
3
19
1
— According to the Chaikin Power Bar, Small Cap stocks and Large Cap stocks remain Bullish. Major indexes are mixed.
* * * *
Sector Tracker
Sector movement over the last 5 days
Communication
+6.34%
Information Technology
+5.56%
Discretionary
+1.87%
Financial
+1.18%
Industrials
+1.05%
Real Estate
-0.12%
Health Care
-0.42%
Staples
-0.76%
Utilities
-0.91%
Materials
-1.24%
Energy
-1.80%
* * * *
Industry Focus
Regional Banking Services
70
64
10
Over the past 6 months, the Regional Banking subsector (KRE) has outperformed the S&P 500 by +0.91%. Its Power Bar ratio, which measures future potential, is Very Strong, with more Bullish than Bearish stocks. It is currently ranked #11 of 21 subsectors and has moved up 1 slot over the past week.
You have received this e-mail as part of your subscription to PowerFeed. If you no longer want to receive e-mails from PowerFeed, click here.
You're receiving this e-mail at diansastroxz.forex@blogger.com.
For questions about your account or to speak with customer service, call +1 (877) 697-6783 (U.S.), 9 a.m. - 5 p.m. Eastern time or e-mail info@chaikinanalytics.com. Please note: The law prohibits us from giving personalized investment advice.
Any brokers mentioned constitute a partial list of available brokers and is for your information only. Chaikin Analytics, LLC, does not recommend or endorse any brokers, dealers, or investment advisors.
Chaikin Analytics forbids its writers from having a financial interest in any security they recommend to our subscribers. All employees of Chaikin Analytics, LLC (and affiliated companies) must wait 24 hours after an investment recommendation is published online – or 72 hours after a direct mail publication is sent – before acting on that recommendation.
This work is based on SEC filings, current events, interviews, corporate press releases, and what we've learned as financial journalists. It may contain errors, and you shouldn't make any investment decision based solely on what you read here. It's your money and your responsibility.


Post a Comment
Post a Comment