| My wife recently filled our Jeep’s gas tank and came home giddy.
“It was only about $40 to fill up,” she exclaimed.
My first thought was: only???
When we bought the Jeep in 2020, it cost about $30 to fill up the gas tank.
But now we’re excited when that cost is only $40.
I believe this happiness will be short-lived … and I’ll tell you why. Enjoy Lower Gas Prices Now Because It Won’t Last There’s one person I trust when it comes to looking at oil and gas prices.
His name is Patrick De Haan, and he’s the head of petroleum analysis at GasBuddy.com — a website that tracks nationwide gas prices.
I’ve interviewed Patrick numerous times and think there’s no better source to go to when you want to know about gas prices.
I always take notice when he produces an outlook for gas prices like the one he sent out on Twitter earlier this week: 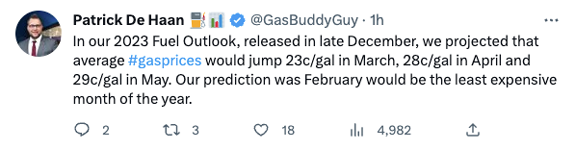 He’s telling us that gas prices were at their lowest point last month and will start to climb now. And those prices won’t subside any time soon.
Here’s where average gas prices stand now: 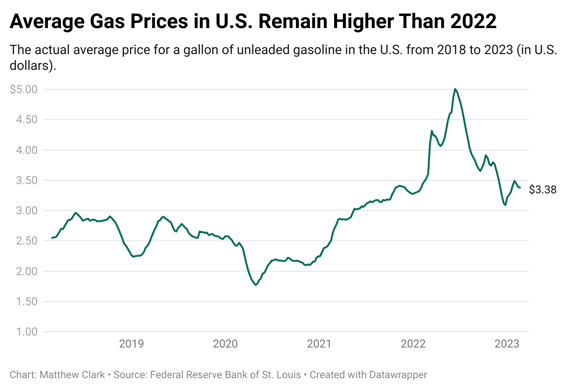 (Click here to view larger image.) Federal Reserve Bank of St. Louis data shows the average price of a gallon of gas is around $3.38 right now.
It’s well below the recent peak of $5 in mid-2022, but you can see that gas prices have been trending higher since December (more on that below).
And De Haan’s research says it’s only getting higher.
Here’s why…
 | Warren Buffett, Ray Dalio and Goldman Sachs all agree. Now’s the time to bet BIG on oil. And Adam O’Dell just revealed the details on his No. 1 oil stock for 2023. An oil company he believes could hit 100% gains in the next 100 days. And beat the gains of Exxon, Marathon and Occidental. Click here to watch. |
Biden’s Strategic Oil Reserves Folly and More! In order to push down gas prices last year, President Joe Biden tapped into the Strategic Oil Reserves.
This is the largest publicly known emergency supply of oil in the world. Tanks in Louisiana and Texas can hold up to 714 million barrels of oil in the event of an emergency.
But take a look at what that drawdown has done to the U.S. emergency supply: Strategic Oil Reserves Hit 40-Year Lows 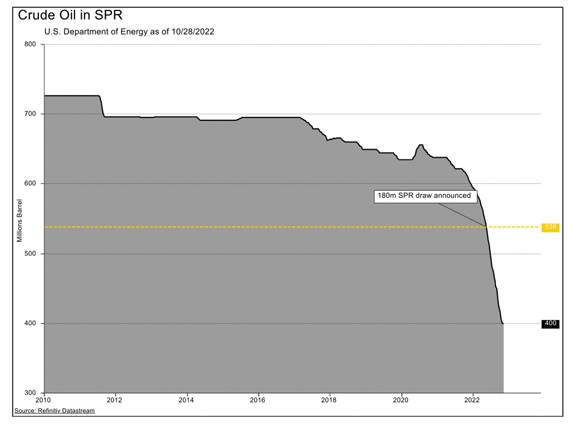 (Click here to view larger image.) While gas prices fell as a result, it has created a massive new problem: The government has to replenish the supply by mandate.
It started that process in December 2022.
Look back at the chart of gas prices I showed you earlier. You’ll see that is when gas prices started to rise again.
In mid-December, the average price of a gallon of gas was around $3.10. Now, it’s close to $3.40. That’s almost 10% higher in the span of two months!
The government is trying to replenish supply at a rapid pace. And with our oil reserves already at a 40-year low, tapping into those again to lower prices isn’t an option.
On top of that, demand isn’t likely to cool off anytime soon: - Historically, oil and gas demand rises into the summer months as people travel more during warmer months.
- And we can’t forget about the Russia-Ukraine war that is pressuring European countries to find resources outside of oil-rich Russia.
While we may end up paying more at the pump, this is an incredible situation for investors. Find Opportunity in This Oil and Gas Trend With so many factors driving demand for oil, that means one thing: Stocks in U.S. oil and gas production are set for new highs.
Because we can’t draw into our reserves anymore, one solution to solve the demand for oil is to allow U.S. producers to drill for more.
This means we’re set for another boom in these stocks. Oil and Gas Stocks Have Pummeled the Broader Market 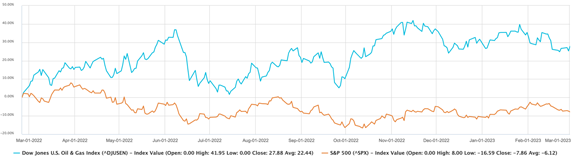 (Click here to view larger image.) The chart above shows the movement of the Dow Jones U.S. Oil & Gas Index (the blue line) and the S&P 500 (red line) since the start of Russia’s invasion of Ukraine on February 24, 2022.
The Dow Jones U.S. Oil & Gas Index has jumped 27.8% since then.
The S&P 500 is down 7.7% during the same time.
Our proprietary Stock Power Ratings system is on top of things.
I ran an “X-ray” of the iShares U.S. Oil & Gas Exploration & Production ETF (NYSE: IEO), an exchange-traded fund (ETF) that holds 48 of the top U.S. oil and gas stocks.
Of those, 40 rated “Bullish” to “Strong Bullish” on our system.
Of note, only two companies in the ETF are rated “Bearish” or worse.
The average rating of all the stocks in IEO is a “Bullish” 78.
That means most of these companies will provide massive returns when the government realizes it has to turn up domestic oil production to combat higher gas prices.
Keep a sharp eye on these oil and gas producers in the coming months.
Note: If you’re looking for more guidance on how to play this bullish movement for oil, my colleague Adam O’Dell is taking advantage with his No. 1 oil stock.
He believes this stock has everything it needs to soar 100% in only 100 days, and he’ll tell you why in his “Oil Super Bull Summit.”
Click here to watch Adam’s exclusive presentation now. Stay Tuned: A Company That Bolsters IT Infrastructure There is so much innovative tech out there these days. But a reliable network is crucial as our world becomes more connected by the minute.
I’ll be back on Monday with a stock that builds out IT infrastructure for some massive clients, including some multiple departments within the U.S. government.
Safe trading,

Matt Clark, CMSA®
Chief Research Analyst, Money & Markets
 (Click here to view larger image.) The Bear's Not Over The Buffett Indicator compares the size of the stock market to gross domestic product (GDP), aka the size of the economy. It’s called that because the Oracle of Omaha follows it, and high values warn of stock market weakness.
An alternative view is to consider the size of the stock market relative to the federal debt like you see in the chart above.
Investors have limited resources. They must choose between stocks and bonds.
When the ratio is high, the allocation to stocks is too high.
At the bottom in red is an indicator showing how far the ratio from its high.
At the recent peak, the ratio was at the same level reached in 2000, before a 16-year bear market in Nasdaq 100 stocks unfolded.
Bottom line: Previous peaks also took time to recover. This is bearish for stocks, and it's pointing to years of potential underperformance.
Check Out the Latest From Stock Power Daily: |
Privacy Policy
The Money & Markets, P.O. Box 8378, Delray Beach, FL 33482.
To ensure that you receive future issues of Money & Markets, please add info@mb.moneyandmarkets.com to your address book or whitelist within your spam settings. For customer service questions or issues, please contact us for assistance.
The mailbox associated with this email address is not monitored, so please do not reply. Your feedback is very important to us so if you would like to contact us with a question or comment, please click here: https://moneyandmarkets.com/contact-us/
Legal Notice: This work is based on what we've learned as financial journalists. It may contain errors and you should not base investment decisions solely on what you read here. It's your money and your responsibility. Nothing herein should be considered personalized investment advice. Although our employees may answer general customer service questions, they are not licensed to address your particular investment situation. Our track record is based on hypothetical results and may not reflect the same results as actual trades. Likewise, past performance is no guarantee of future returns. Certain investments carry large potential rewards but also large potential risk. Don't trade in these markets with money you can't afford to lose. Money & Markets permits editors of a publication to recommend a security to subscribers that they own themselves. However, in no circumstance may an editor sell a security before our subscribers have a fair opportunity to exit. Any exit after a buy recommendation is made and prior to issuing a sell notification is forbidden. The length of time an editor must wait after subscribers have been advised to exit a play depends on the type of publication.
(c) 2023 Money & Markets, LLC. All Rights Reserved. Protected by copyright laws of the United States and treaties. This Newsletter may only be used pursuant to the subscription agreement. Any reproduction, copying, or redistribution, (electronic or otherwise) in whole or in part, is strictly prohibited without the express written permission of Money & Markets. P.O. Box 8378, Delray Beach, FL 33482. (TEL: 800-684-8471)
Remove your email from this list: Click here to Unsubscribe | | | 


Post a Comment
Post a Comment