Is the S&P 500 Lying to You? |
Money & Markets Daily,
What do you know about the S&P 500?
You may know it as a collection of 500ish stocks large-cap stocks that trade on American exchanges.
You may know it as a measure of the broader stock market. When things are going well, the S&P 500 typically reflects that by going up (the opposite is also largely true).
Maybe you're just interested in the numbers. You know the index is up 26% over the last year — and almost 10% year to date.
That's about all you really need to know to get by as an investor, or so I thought.
Then, a colleague shared the chart below:
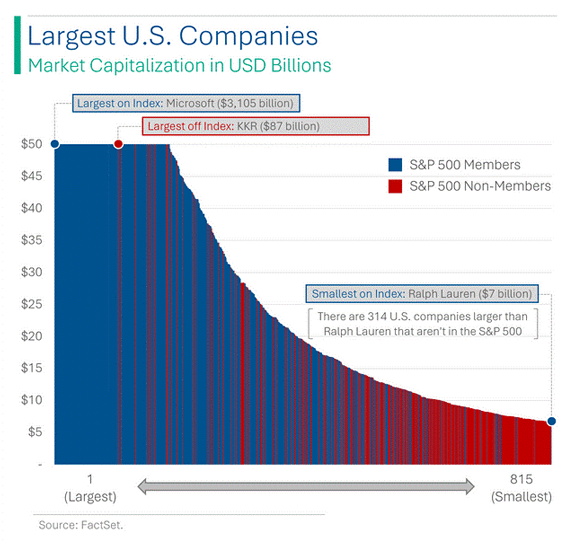
It shows that a large market cap isn't the only requirement for companies to be included on that lauded list of 500 (it's really 503 stocks at this moment).
And the financial experts that I have the pleasure of working with every day chimed in with analysis that frankly blew my mind.
Today's Money & Markets Daily is a little different. Since we talk so much about the S&P 500 (it is "the market" we use as a benchmark in Green Zone Power Ratings), I wanted to share this analysis from Adam O'Dell, Mike Carr and Matt Clark.
It opened my eyes to what's really going down on Wall Street. And it makes me want to beat "the market" even more using tools like Green Zone Power Ratings!
Here's what they had to say…
 | This $10 microchip company is at the heart of the new technology experts say will mint the first trillionaire. Find out more. |
What's Really Going on With the S&P 500
Before I get too far into this, I want to make one thing clear: There's nothing wrong with the S&P 500.
It tracks some of the largest and most successful companies in America. It has also handed investors incredible gains, which has garnered it a massive following around the world. Its market cap hit $42 trillion by the end of 2023.
But Money & Markets Chief Market Technician Mike Carr has a better explanation:
Officially, the goal of the index is to replicate the performance of the broad stock market. Assuming the most money flows in and out of the largest stocks, the committee that maintains the index knows they need to focus on the largest stocks.
To reflect the market, they need exposure to all sectors and have to represent the sectors in a way that represents the broad market. That means appropriate weighting by sector, which pushes them to larger stocks to meet the goal with the minimum number of stocks required.
They also need to offer stability (tax efficiency) since kicking stocks out will create taxable events for many funds and investors. Taxable events should always be minimized.
In this context, the index makes sense and has a 90%+ correlation to other indexes that are more inclusive, so it does work.
Of course, there's always more going on under the hood. Per, Mike:
Unofficially, the goal of the index is to generate revenue for S&P through licensing deals. Using the largest stocks ensures it is investable even when trillions of dollars are indexed to it. The more money invested in the fund, the larger the fees.
Keeping the index stable keeps licensing companies happy. It reduces trading costs and risks associated with tracking errors that arise whenever a trade occurs.
Again, there's nothing wrong with this approach. We're all trying to make money with the stock market!
Our chief investment strategist, Adam O'Dell, said it pretty succinctly:
There’s also the argument that it’s a “momentum” fund.
It’s market-cap weighted. As price goes higher … market cap goes higher … and then the allocation percentage goes higher.
So you could almost call it an active momentum fund designed to enrich S&P.
That always comes as a surprise to folks who believe it’s a purely “passive” index.
Now that we have a better understanding of what drives the S&P 500 let's look at it through the lens of Green Zone Power Ratings…
 | From our Partners at Banyan Hill Publishing. $15.7 billion is at stake — and the best chance you’ll have at claiming your fair share … and becoming one of America’s next big winners … is to take these three simple steps before June 30. Click for details. |
S&P 500 and Green Zone Power Ratings
Here's what Chief Research Analyst Matt Clark found after running the numbers:
Regularly, I perform what we call an ETF X-ray. This is where I take all of the holdings of an exchange-traded fund and run them through our Green Zone Power Ratings.
This allows me to see what an ETF rates based on the averages of its holdings.
But it also gives me insight into the market-crushing stocks (highly rated) and the stocks to avoid (low-rated).
For this exercise, I took all of the stocks in the S&P 500 and ran them through an X-ray… and the results were interesting, to say the least:
On average, all stocks in the S&P 500 rate 49 out of 100, or “Neutral.” If this were an ETF, our recommendation would be to watch — not buy or sell.
Drilling deeper into factor ratings, we can see where the S&P 500 shines… and where it falls short:
- Momentum — 49.
- Size — 9.
- Volatility — 59.
- Value — 40.
- Quality — 70.
- Growth — 62.
Of all the stocks on the index, a little more than 50 rate “Strong Bullish” on our system. However, more than 70 rate “Avoid,” and more than 120 are “Neutral.”
That last line stuck with me. Of the 500ish stocks in the S&P 500, only 1 in 10 are rated "Strong Bullish" and set to beat the broader index by 3X.
And that's why Adam created Green Zone Power Ratings. He wanted to develop a system that anyone can use to find stocks with the greatest potential.
Go ahead and try it for yourself.
Until next time,

Chad Stone
Managing Editor, Money & Markets Daily

The Fed Doesn't Have to Cut Rates
Traders were disappointed by the latest reading of the Consumer Price Index (CPI). The official data confirmed what every consumer knows — inflation is on the rise again. This news dampened hopes for interest rate cuts.
The probability of a cut at the Federal Reserve’s June meeting fell from 56% to 19% on Wednesday. However, the minutes of the March meeting released later that day showed that the Fed might be ready to boost markets without cutting rates.
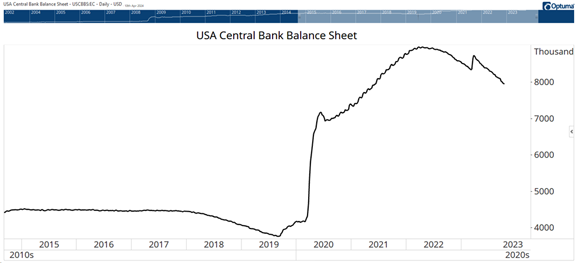
The Fed's balance sheet reached $8.9 trillion in 2022 as officials pumped money into the economy. Increases in the balance sheet come from buying bonds, which adds money to the economy. For the last two years, the Fed has been reducing the size of the balance sheet and withdrawing money from the economy. The size of the balance sheet is shown in the chart below.
The minutes showed that in March, “The vast majority of participants thus judged it would be prudent to begin slowing the pace of runoff fairly soon.” If the Fed reduces its drawdown later this year, that could be equivalent to a 0.125% cut in interest rates.
The news could have an even more dramatic impact on the markets. To benefit from any changes to the balance sheet, it could be worth trading SPDR S&P 500 (NYSE: SPY) calls before upcoming meetings.
— Mike Carr, Chief Market Technician, Money & Markets
(Click here to view larger image.)
Check Out More From Money & Markets Daily:


Post a Comment
Post a Comment