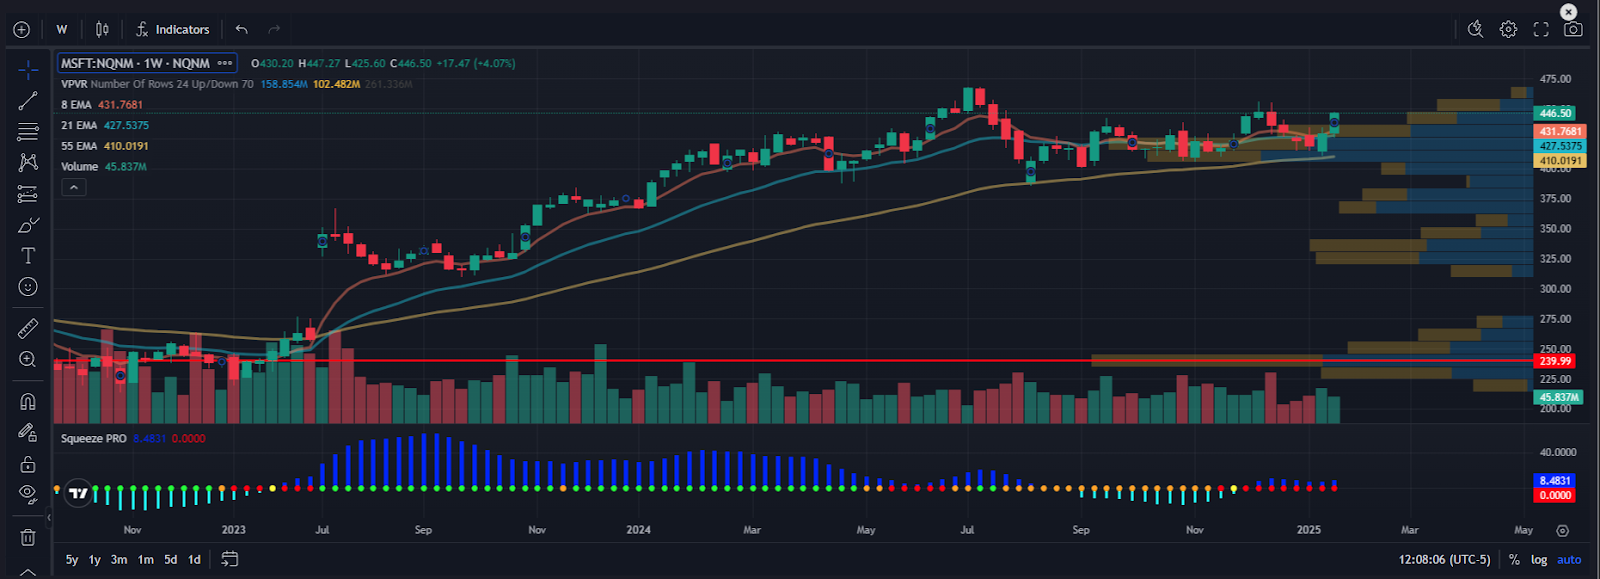
| Squeeze Setup Microsoft's price action is showing a textbook squeeze formation across multiple timeframes. The stock is just below its 52-week high of $468.35, and is exhibiting signs of compression identified by the S.A.M. AI Scanner. In simple terms, a squeeze occurs when price volatility contracts, creating a "coiling" effect similar to a spring being wound tighter and tighter. These low-volatility periods often precede significant price moves, and when they occur near major levels like 52-week highs, they can signal a potential breakout. Currently, MSFT has: - A weekly chart squeeze, indicating longer-term energy building up.
- Intraday squeezes forming on the 5-, 10-, 15-, and 30-minute timeframes, suggesting shorter-term momentum is setting the stage for a near-term move.
The squeeze is created when Bollinger Bands and Keltner Channels compress together, signaling that the stock is storing energy for its next breakout. - Institutional accumulation is likely driving the current consolidation.
- A breakout above $468.35—its 52-week high—could trigger significant upside momentum.
This multi-timeframe alignment of squeezes provides us with a clear level to trade against and increases the probability of a strong move higher if the squeeze releases to the upside. EMA Stack Analysis - Perfect daily EMA alignment (8, 21, 34, 55): Shorter EMAs are stacked above longer ones, signaling strong bullish momentum.
- Weekly chart confirming the broader uptrend: Higher timeframes add confirmation to the setup.
- Price finding support at key EMA levels: This is a clear sign that buyers are stepping in at critical points.
- Higher lows forming across multiple timeframes: A classic bullish continuation pattern.
When we see EMAs aligned like this, it often precedes significant upside moves. This "bullish ladder" structure suggests both short-term momentum and long-term trend are aligned to the upside. Company Outlook Although my primary focus is on technicals, it's worth briefly noting Microsoft's strong position in the AI and cloud computing space: - AI Leadership: Microsoft's partnership with OpenAI, including its integration of cutting-edge AI tools like Copilot, positions it as a leader in the AI revolution.
- Revenue Growth: Microsoft's cloud segment continues to grow at a double-digit pace, further strengthening its bull case.
While the stock has slightly underperformed the Nasdaq 100 over the past year (10.8% vs. 25.6%), this could set the stage for a "catch-up" move as AI adoption accelerates. Your Action Plan While the setup in MSFT is strong, I won't be trading it this week as earnings are set to be released on January 29th. Earnings events create significant opportunities but also come with heightened risks, like unpredictable price action and the dreaded volatility crush that can wipe out options premiums—even if the stock moves in your favor. This is why many traders avoid earnings plays altogether. But what if you could trade earnings with a proven, reliable strategy? That's exactly what One Ticker Payouts is designed for. My unique approach identifies high-probability setups around earnings, allowing you to profit without gambling on unpredictable outcomes or falling victim to volatility crush. Earnings Season Is Here: Are You Ready? With MSFT's earnings just around the corner, the opportunity is clear—but preparation is key. Discover how my One Ticker Payouts strategy can help you trade earnings with confidence, precision, and consistency. 👉 Click here to learn more and start trading smarter this earnings season. | 


Post a Comment
Post a Comment