04/25/2025 | Unsubscribe |
Mission: Ultimate Alerts was designed for active and passive US investors to notify you about short-term and long-term risks and opportunities. Our mission is to provide you with an objective and historically accurate understanding of financial markets, macroeconomics and how it all affects your saving and investing. |
|
|
Good Morning! |
Here are some important charts and ideas capturing the latest trends in US markets to help you understand what is happening from multiple different perspectives: |
 | Nick Colas & Jessica Rabe (DataTrek) @DataTrekMB |  |
| |
S&P sector correlations are at levels consistent with prior panic periods like 2019's US/China trade war or Q4 2018's Fed policy mistake. Any sustainable rally must see them decline. | | 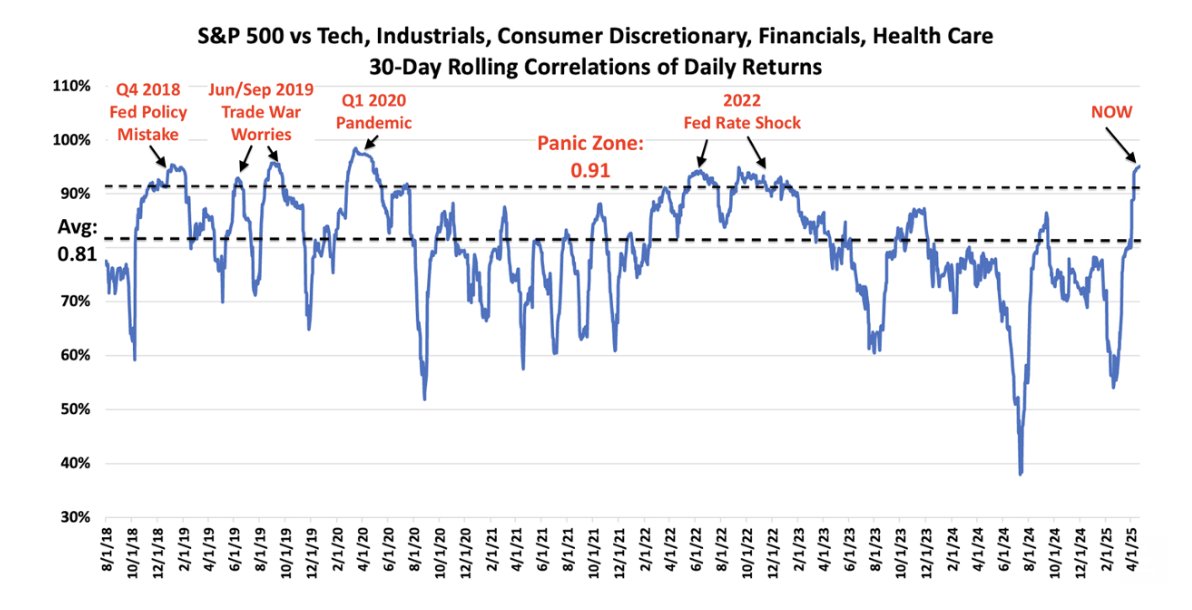 | | | 5:27 PM • Apr 24, 2025 | | | | | | 4 Likes 1 Retweet | 0 Replies |
|
|
📈 What This Chart Shows |
This tracks the 30-day rolling correlation between the S&P 500 and its key sectors (tech, industrials, discretionary, financials, health care). Correlations above 0.95 are historically associated with "panic periods" like the 2018 Fed policy mistake, the 2019 trade war, and the 2020 pandemic. |
🚨 Why This Matters |
When everything moves together, it often signals fear-driven selling or forced positioning — not healthy, diversified leadership. High correlation usually means investors are de-risking across the board, rather than favoring specific sectors. Historically, sustainable market rallies don't begin until correlations fall, signaling the return of sector leadership and investor confidence.
|
 | Daily Chartbook @dailychartbook | |
| |
"US global equity leadership is at a peaking point." @Callum_Thomas@topdowncharts | | 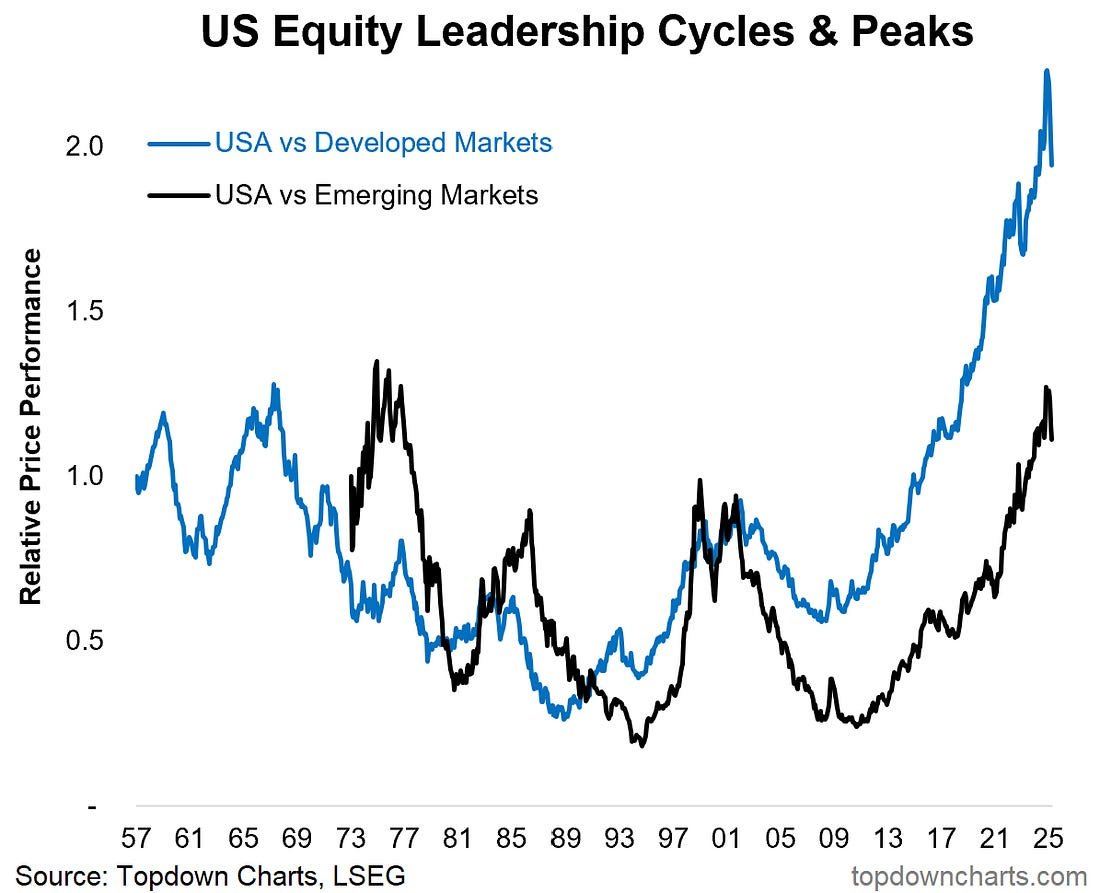 | | | 12:15 PM • Apr 24, 2025 | | | | | | 35 Likes 4 Retweets | 11 Replies |
|
|
📈 What This Chart Shows |
This chart tracks how U.S. stocks have performed relative to Developed Markets (blue line) and Emerging Markets (black line) over time. As of 2025, U.S. equity outperformance has reached levels not seen since past historical peaks, suggesting a possible leadership turning point. |
📊 Key Takeaways |
U.S. equities have outperformed global peers for over a decade, especially post-2009. Historically, these relative performance cycles tend to mean-revert, meaning global equities could catch up or lead next. The current U.S. leadership spike looks stretched, increasing the odds of international outperformance.
|
 | unusual_whales @unusual_whales | |
| |
U.S. Companies are declaring bankruptcy at the fastest pace in 15 years, per S&P Global: | | 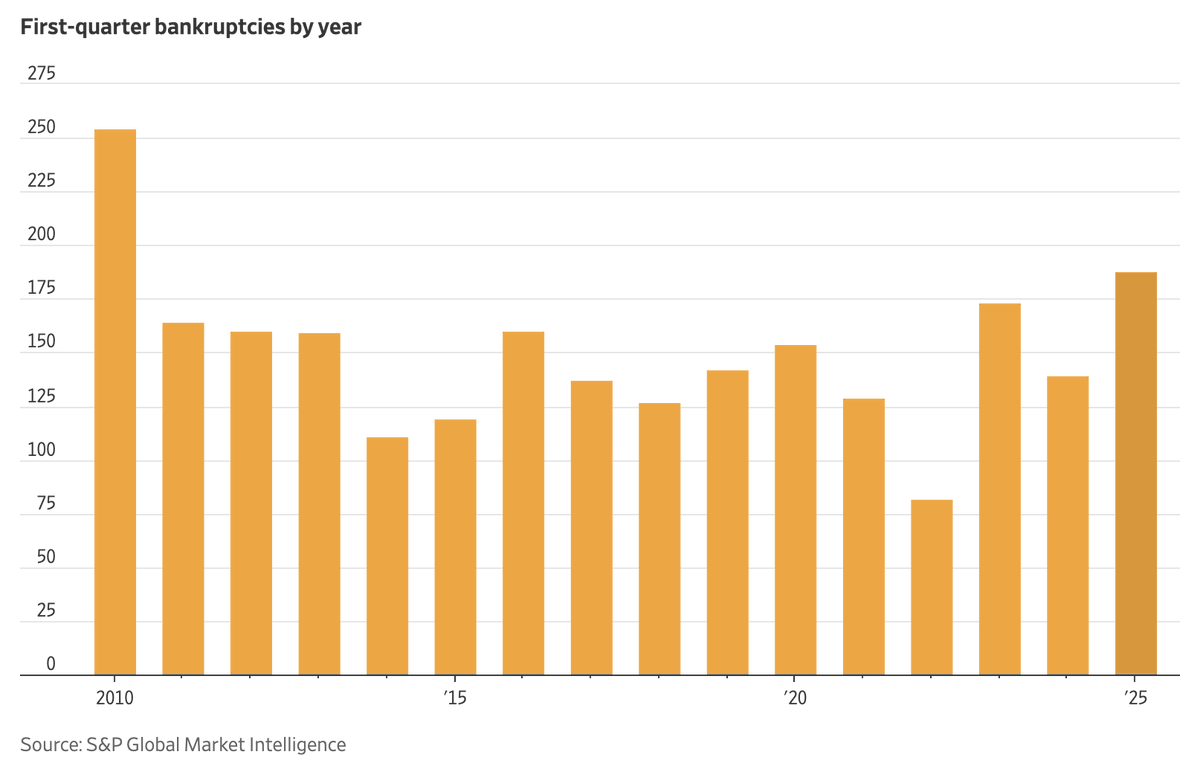 | | | 11:17 AM • Apr 24, 2025 | | | | | | 3.95K Likes 996 Retweets | 285 Replies |
|
|
📉 What This Chart Shows |
In Q1 2025, U.S. companies filed for bankruptcy at the highest pace since 2010, with over 180 filings — the fastest start to any year in 15 years, according to S&P Global. This spike reflects growing financial stress despite a still-low unemployment rate and solid consumer spending. |
🔍 Quick Take in 3 Lines: |
Corporate bankruptcies are surging — a red flag that high rates, slowing growth, and tight credit are starting to bite. |
Short-term, this may lead to job losses, rising credit defaults, and pressure on high-yield bonds or small-cap stocks. |
This trend could intensify a downturn if it spreads to larger or systemically essential companies. |
 | Spencer Hakimian @SpencerHakimian | |
| |
Freight volume has fallen right off a cliff in the past 10-14 days. We're rapidly approaching *COVID* levels in freight volume. We are probably *already* in a recession. Now, it's just about damage control. Policy disaster. H/T @FreightAlley | |  | | | 1:05 AM • Apr 24, 2025 | | | | | | 3.06K Likes 856 Retweets | 143 Replies |
|
|
📉 What This Chart Shows |
This is the Outbound Tender Volume Index (OTVI) — a leading indicator of U.S. freight demand. Over the past 10–14 days, volume has sharply dropped, approaching pandemic-era lows. That signals a sudden slowdown in goods movement and business activity. |
🔍 Quick Take in 3 Lines: |
Freight volume is falling fast, a worrying sign for the real economy — fewer shipments often mean falling consumer demand or overstocked inventories. |
In the short term, this points to a rise in the risk of recession, even if it is not officially declared. |
It could pressure industrial earnings, trucking companies, and employment in logistics-heavy sectors in the long term. |
⚖️ Counterpoints to Consider |
📦 Freight ≠ Whole Economy: Services still make up most of GDP, and freight weakness may be isolated to goods sectors (retail, e-commerce, manufacturing). ⏳ Seasonal Noise or Inventory Flush? This drop might reflect inventory drawdowns or post-holiday normalization, not a full-blown recession. 🧮 Lagging effect of policy: Monetary and fiscal policy works with a delay — which means if there is no clarity in trade policy, things could get worse.
|
 | Craig Fuller 🛩🚛🚂⚓️ @FreightAlley | |
| |
Year-over-year trucking activity out of Los Angeles down 23%. It will likely drop to 50% in the coming weeks if there isn't trade war resolution. Massive layoffs coming to the West Coast trucking sector | | 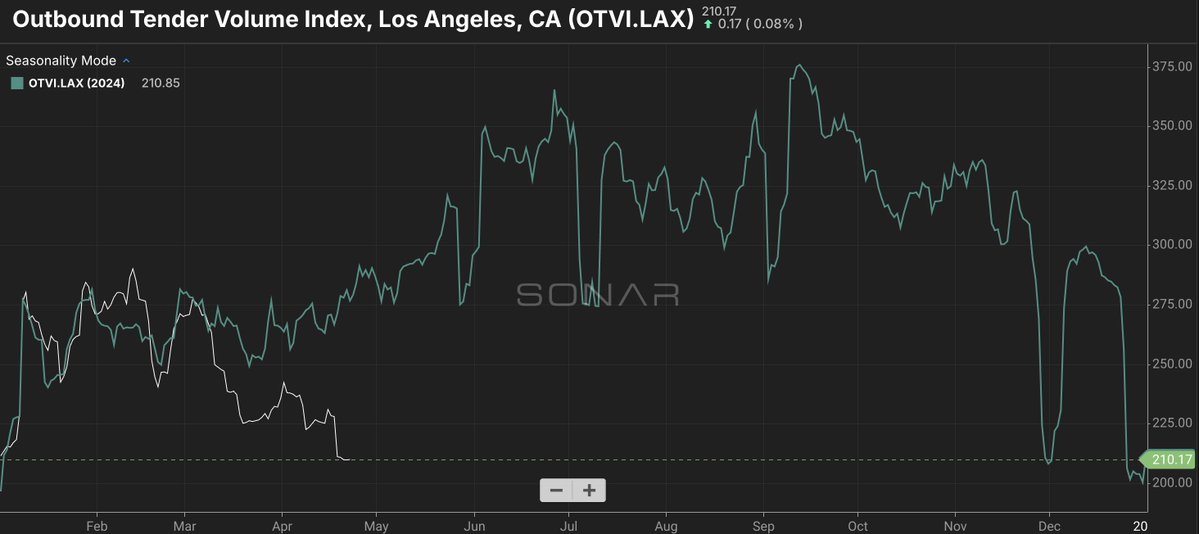 | | | 3:09 AM • Apr 24, 2025 | | | | | | 1.05K Likes 296 Retweets | 50 Replies |
|
|
🚛 What This Chart Shows
This is the Outbound Tender Volume Index (OTVI) for Los Angeles, one of the largest freight hubs in the U.S. Trucking volume is down 23% year-over-year, and falling fast — a concerning signal that trade activity and goods movement out of SoCal is drying up. |
⚠️ Why This Matters |
Los Angeles is a primary gateway for U.S. imports, especially from Asia. A steep drop in trucking here suggests declining container volumes, possibly due to supply chain disruptions, weak consumer demand, or trade policy tensions. If volume drops 50% as feared, it could result in significant layoffs in West Coast logistics, warehousing, and trucking.
|
 | Mark Ungewitter @mark_ungewitter | |
| |
Note to self. Non-U.S. equities are unlikely to produce absolute returns during an SPX bear market, even if generating relative strength. | | 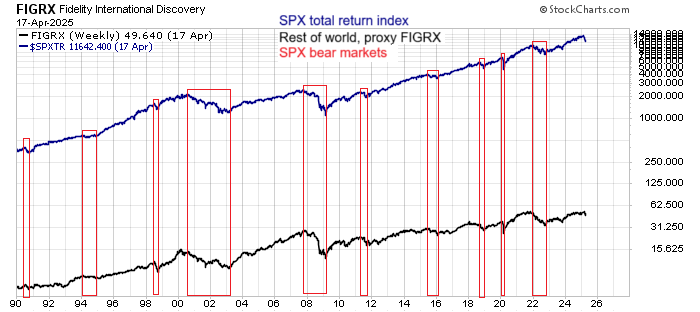 | | | 1:21 PM • Apr 24, 2025 | | | | | | 84 Likes 16 Retweets | 26 Replies |
|
|
📌 What This Chart Shows
The chart compares the S&P 500 Total Return Index (blue) with the Fidelity International Discovery Fund (FIGRX, black) — a proxy for non-U.S. equities — from 1990 to 2025. The red boxes highlight SPX bear markets. During these periods, non-U.S. equities typically struggled in absolute terms, even if they outperformed the U.S. on a relative basis. |
💡 Key Insight |
Non-U.S. stocks may offer "relative strength" during U.S. bear markets — but rarely produce actual (absolute) gains. |
|
|
This means they might fall less but often decline or stall when U.S. equities are under pressure. |
|
That's it for today! |
Please reply to this email if today's newsletter helped you in any way. Your feedback is super important to us to continue improving the quality and depth of the information that you receive. |
|
|
📌 Did we land in your inbox? Please make sure our emails arrive in your inbox where you can see them immediately. |
|
Best Regards, |
Ultimate Alerts Team |
|
Disclaimer |
The content distributed by UltimateAlerts.com is for general informational and entertainment purposes only and should not be construed as financial advice. You agree that any decision you make will be based upon an independent investigation by a certified professional. Stocks/Assets featured in this newsletter may be owned by owners/operators of this website, which could impact our ability to remain unbiased. If you click on an affiliate link the website owner may receive compensation. Although we have sent you this email, UltimateAlerts.com does NOT specifically endorse this product nor is it responsible for the content of this advertisement. |
Please read and accept full disclaimer and privacy policy before reading any of our content: www.ultimatealerts.com/c/disclaimer/ and www.ultimatealerts.com/c/privacy-policy |

Post a Comment
Post a Comment