05/06/2025 | Unsubscribe |
Mission: Ultimate Alerts was designed for active and passive US investors to notify you about short-term and long-term risks and opportunities. Our mission is to provide you with an objective and historically accurate understanding of financial markets, macroeconomics and how it all affects your saving and investing. |
|
|
Good Morning! |
Here are some important charts and ideas capturing the latest trends in US markets to help you understand what is happening from multiple different perspectives: |
 | Joe Weisenthal @TheStalwart |  |
| |
Bank of America says the S&P 500 is expensive on 19 out of 20 different valuation metrics | | 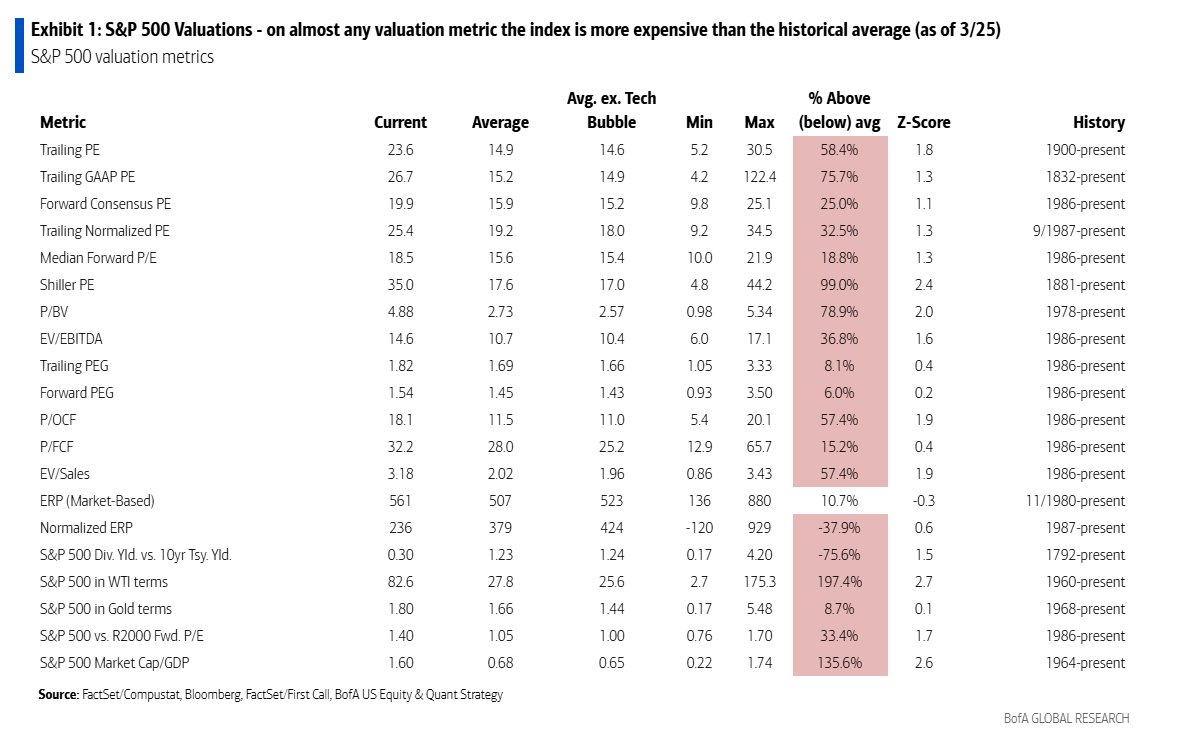 | | | 1:06 PM • Apr 28, 2025 | | | | | | 516 Likes 119 Retweets | 34 Replies |
|
|
🔍 S&P 500 Valuations Are Stretched Across the Board |
🧮 19 of 20 metrics = Overvalued: Broad-based deviation from historical norms. 📈 Shiller PE: +99% Above Avg: Historically signals weaker long-term returns. 📊 Buffett Indicator: +135% Above Avg: Market cap far exceeds GDP. 🏷️ Pricey on Cash Flow & Sales: P/FCF and EV/Sales well above average.
|
💼 What This Could Mean for You |
⚠️ Expect Lower Future Returns: High entry valuations = weak long-term upside. 📉 Bigger Drawdown Risk: High valuations = less cushion in selloffs. ⛑️ Weak Risk-Adjusted Returns: Not ideal for new capital deployment. 🛡️ Rebalance Exposure: Consider undervalued global equities, gold (depending on your time-frame), or inflation-linked assets. ⏳ Buy Pullbacks, Not Highs: Be valuation-aware despite short-term strength.
|
🔁 Alternative Views to Consider |
🟢 "New Normal" for Tech?: AI-driven growth may justify high multiples. 🟠 Lower Rates Support Valuations: Falling yields reduce discount rate pressure. 🔵 Index Skew Matters: Megacaps distort — median stocks may be fairly valued.
|
 | Craig Shapiro @ces921 | |
| |
Dallas Fed Regional PMI Survey: Pretty Awful Definition of Stagflation: New Orders plummeting while Prices Paid rip higher | | 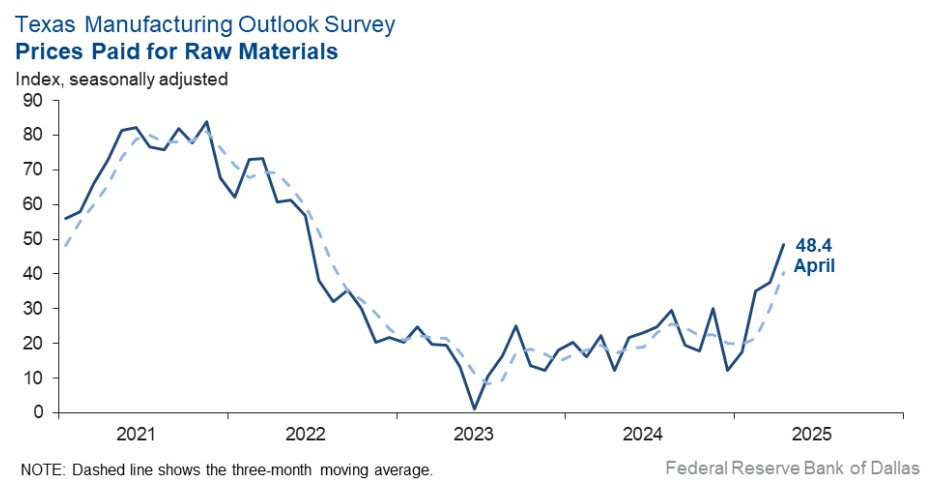 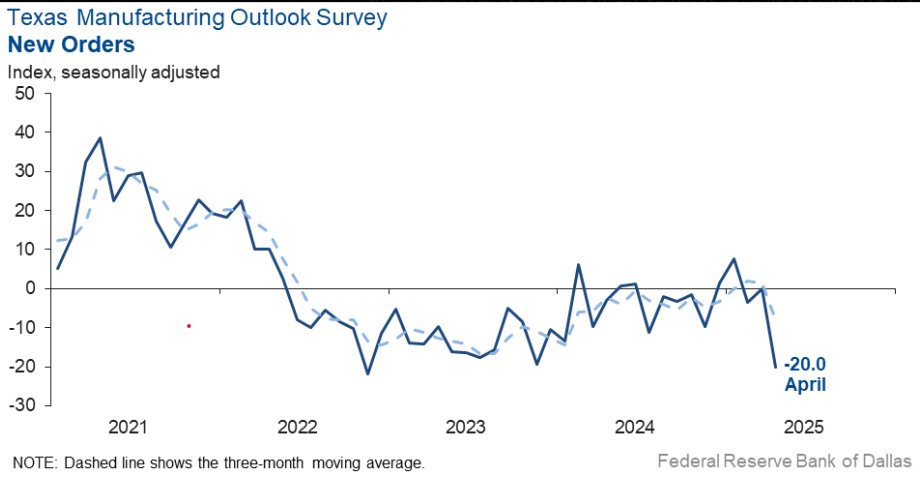 | | | 2:34 PM • Apr 28, 2025 | | | | | | 197 Likes 56 Retweets | 18 Replies |
|
|
🔍 Stagflation Risk Emerging: Prices Up, Orders Down |
📈 Raw Material Costs Jumped: Prices Paid hit 48.4 in April — the highest since 2022. 📉 New Orders Collapsing: Regional PMIs show weakening demand. ⚠️ Classic Stagflation Setup: Rising costs + slowing growth = margin risk.
|
💼 What This Could Mean for You |
🚫 Profit Squeeze Ahead: Companies without pricing power will feel the margin pinch. 🔄 Avoid Cyclicals: Manufacturing and materials are especially vulnerable. 🛡️ Seek Resilience: Favor firms with strong pricing power — e.g., healthcare, utilities, subscription tech. 📉 Watch Bond Exposure: Sticky inflation hurts duration — TIPS or short-duration bonds may help.
|
🔁 Alternative Takes to Consider |
🟢 Temporary Spike?: Tariffs or supply shocks may fade, not actual inflation. 🟠 Fed May Stay Dovish: If growth slows, policy support could buffer markets. 🔵 Market May Already Price This In: Fear-driven pullbacks can create opportunity.
|
 | Daily Chartbook @dailychartbook | |
| |
"It normally takes 18 months on average for the US to negotiate a trade deal." - Apollo Sløk | | 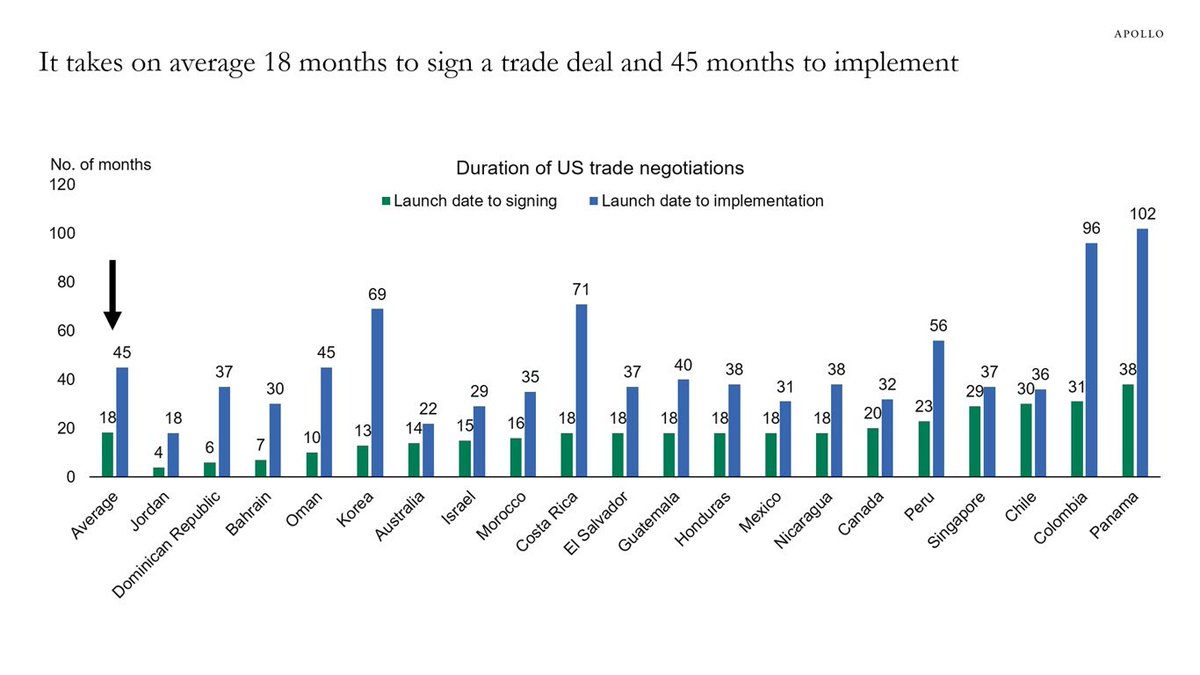 | | | 8:00 AM • Apr 28, 2025 | | | | | | 90 Likes 21 Retweets | 12 Replies |
|
|
🔍 Trade Deals Move Slowly — Tariff Relief Won't Be Quick |
📊 Avg. Timeline: 18 months to sign, 45 months to implement a U.S. trade deal. 🚫 Fast Tariffs, Slow Reversals: Policy shocks hit quickly, but fixes drag. 🧭 Wide Variability: Panama took 102 months, Jordan just 18 — high uncertainty = persistent risk.
|
💼 What This Could Mean for You |
⚠️ No Quick Fix: Tariff pain may persist well into 2026+. 🏭 Avoid Exposed Sectors: Industrials, semis, logistics, autos at risk. 📉 Lingering Earnings Pressure: Multinationals won't rebound fast. 🔍 Go Domestic: Favor sectors tied to U.S. demand — utilities, healthcare, staples.
|
🔁 Alternative Views to Consider |
🟢 Political Pause Possible: Tariffs may ease before elections, even without formal deals. 🟠 Markets Front-Run Policy: Signals can move stocks before paperwork catches up. 🔴 Geopolitical Drag = Safe Haven Flows: Could boost USD, Treasuries, or insulated markets.
|
 | Warren Pies @WarrenPies | |
| |
In our view, mkt bottoms have 2 components:
1) Depressed positioning/sentiment AND
2) Technical confirmation (e.g. retest lows, breadth thrust, etc) So far, we don't have the technical confirmation (close), but sentiment/positioning is washed (vol-target exposure - chart below) | | 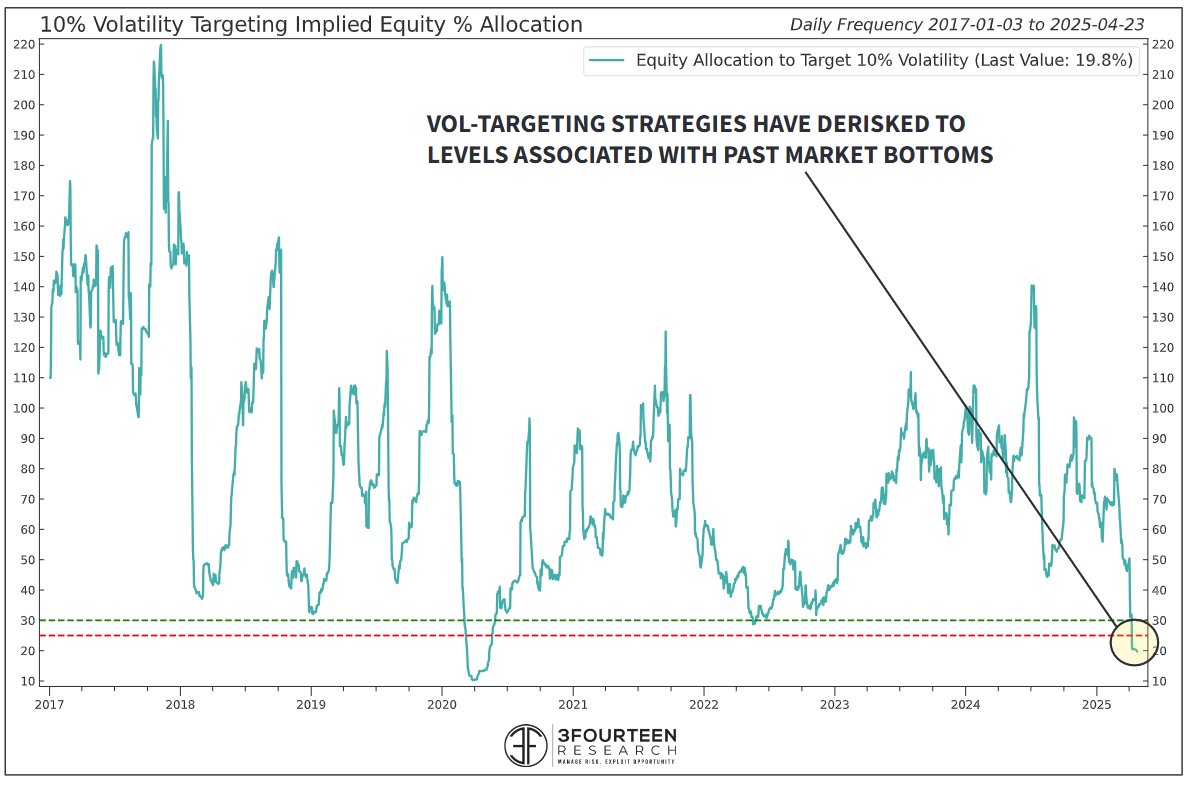 | | | 4:32 PM • Apr 25, 2025 | | | | | | 567 Likes 86 Retweets | 60 Replies |
|
|
🔍 Systematic Funds Are De-Risked to Extreme Lows |
📉 Equity Exposure ≈ 20%: Lowest since the COVID crash and late 2018 — below even August 2024's reset (~50%). 📊 Historic Washout: Sign of deep risk aversion — systematic funds not supporting the market yet. 📐 Bottom Zone Reached: Past lows formed in the 25–40% range, but no technical confirmation yet.
|
💼 What This Could Mean for You |
⚠️ Dip-Buyers Absent: Vol-linked funds still in sell mode — near-term pressure may persist. 📉 Fully Allocated? Brace for Volatility: Markets may lack institutional buying support in the short term. 🛒 Under-Allocated? Start Nibbling: Historically, these washout zones precede strong rebounds. 🧯 Short-Term Pain, Long-Term Gain: If technicals confirm, upside can be significant (a lot of this could have already happened).
|
🔁 Alternative Views to Weigh |
🟢 Sentiment Near Max Pessimism: Even mild good news could spark a sharp rally. 🟠 No Retest Yet: Capitulation or second leg down may still be ahead. 🔴 Volatility Can Linger: Post-crash churn (like 2020) could delay a clean recovery.
|
 | Gunjan Banerji @GunjanJS | |
| |
Correlations among U.S. stocks, bonds, dollar at the highest level since at least 2019–Piper Sandler | | 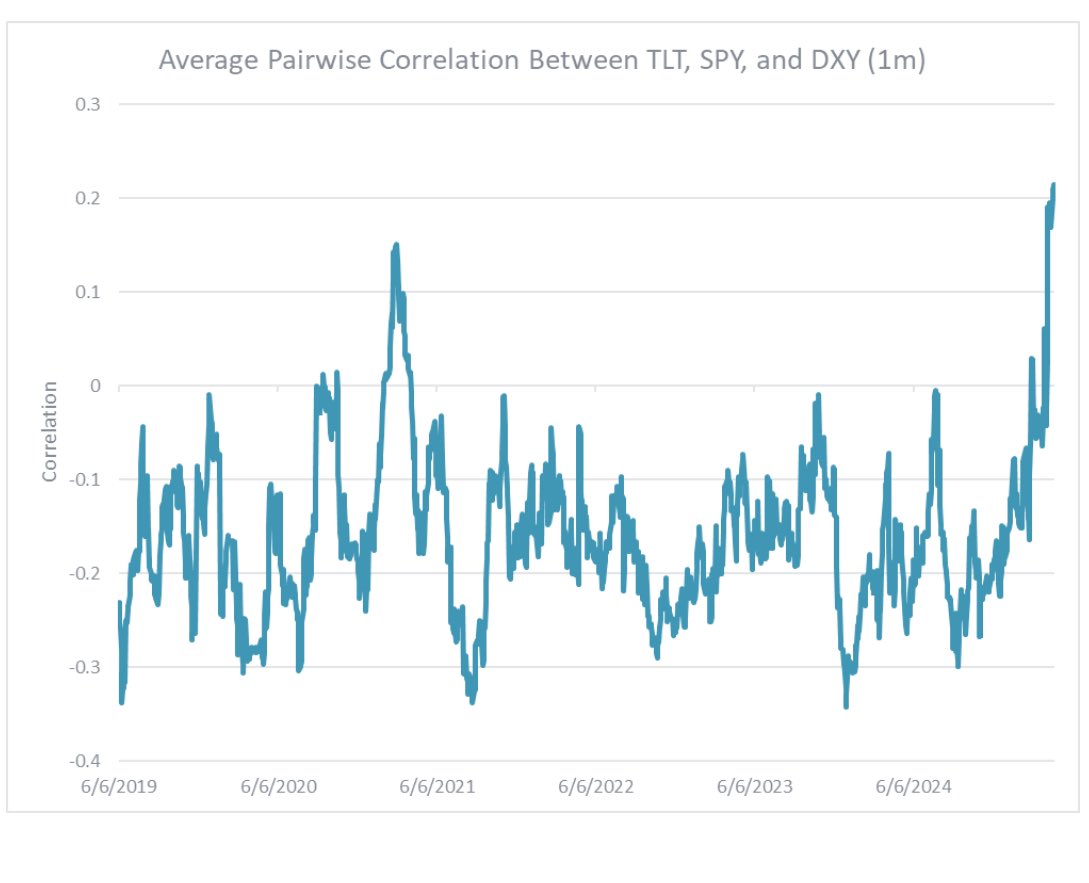 | | | 3:30 PM • Apr 27, 2025 | | | | | | 191 Likes 48 Retweets | 20 Replies |
|
|
🔍 Asset Correlations Are Spiking — Diversification at Risk |
📈 Correlations Near +0.3: Highest since 2019 (and 2020) — stocks, bonds, and the dollar moving together. 🔗 Typical offsets breaking down: Normally, uncorrelated assets are now aligned. 🔄 Diversification Benefits Fading: Classic portfolio buffers may not work.
|
💼 What This Could Mean for You |
⚠️ Diversification Weakness: 60/40 portfolios could see simultaneous drawdowns. 💸 Volatility Risk Rising: High correlation = stress in the system (e.g., inflation, Fed policy). 🛡️ Time for Alternatives: Consider gold, cash, commodities, or volatility hedges. Use tactical or risk-parity strategies.
|
🔁 Alternative Views to Consider |
🟢 Could Normalize Soon: Fed clarity or geopolitical calm may reset correlations. 🟠 One Narrative Driving All Trades: Pivot bets and macro alignment fueling synchronized moves. 🧠 Setup for Rotation: Elevated correlation may precede sharp dispersion and new winners.
|
 | CH @Econimica | |
| |
and on and on it goes... | | 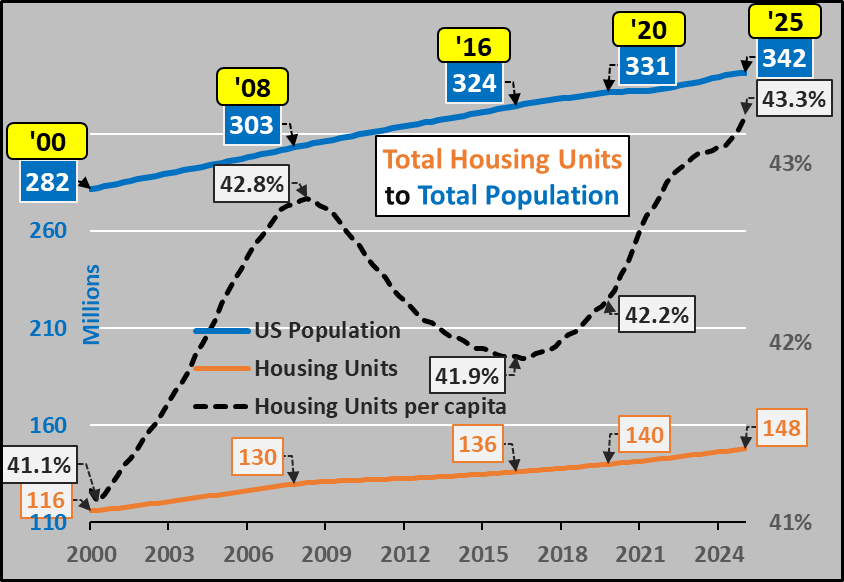 | | | 3:58 AM • Apr 30, 2025 | | | | | | 17 Likes 7 Retweets | 0 Replies |
|
|
📊 U.S. Housing Surges Ahead of Population Growth |
🏘️ Record Housing Ratio: 148M housing units vs. 342M people = 43.3% ratio — highest ever, above 2008 bubble peak (42.8%). 🔼 Since 2000: Housing units +28%, population +21%. 🔁 Full Recovery Post-2008: Housing-per-capita now exceeds pre-crisis highs.
|
💼 What This Could Mean for You |
🏠 Oversupply Risk Rising: Softening demand + high rates may lead to gluts in some regions. 📉 Home Price Pressure: Growth may slow or reverse in overbuilt markets. 💡 Invest Selectively: Focus on tight-supply, high-demand areas. 📊 CPI Impact: Shelter inflation may ease in 2025–2026.
|
🔁 Alternative Views to Consider |
🟢 "Shadow Demand" May Absorb Supply: Millennials forming households late. 🟠 Not All Units Are Usable: Vacancies, second homes distort availability. 🔵 Local Trends Matter: Migration + zoning can still support prices regionally.
|
That's it for today! |
Please reply to this email if today's newsletter helped you in any way. Your feedback is super important to us to continue improving the quality and depth of the information that you receive. |
|
|
📌 Did we land in your inbox? Please make sure our emails arrive in your inbox where you can see them immediately. |
|
Best Regards, |
Ultimate Alerts Team |
|
Disclaimer |
The content distributed by UltimateAlerts.com is for general informational and entertainment purposes only and should not be construed as financial advice. You agree that any decision you make will be based upon an independent investigation by a certified professional. Stocks/Assets featured in this newsletter may be owned by owners/operators of this website, which could impact our ability to remain unbiased. If you click on an affiliate link the website owner may receive compensation. Although we have sent you this email, UltimateAlerts.com does NOT specifically endorse this product nor is it responsible for the content of this advertisement. Please read and accept full disclaimer and privacy policy before reading any of our content: www.ultimatealerts.com/c/disclaimer/ and www.ultimatealerts.com/c/privacy-policy |

Post a Comment
Post a Comment