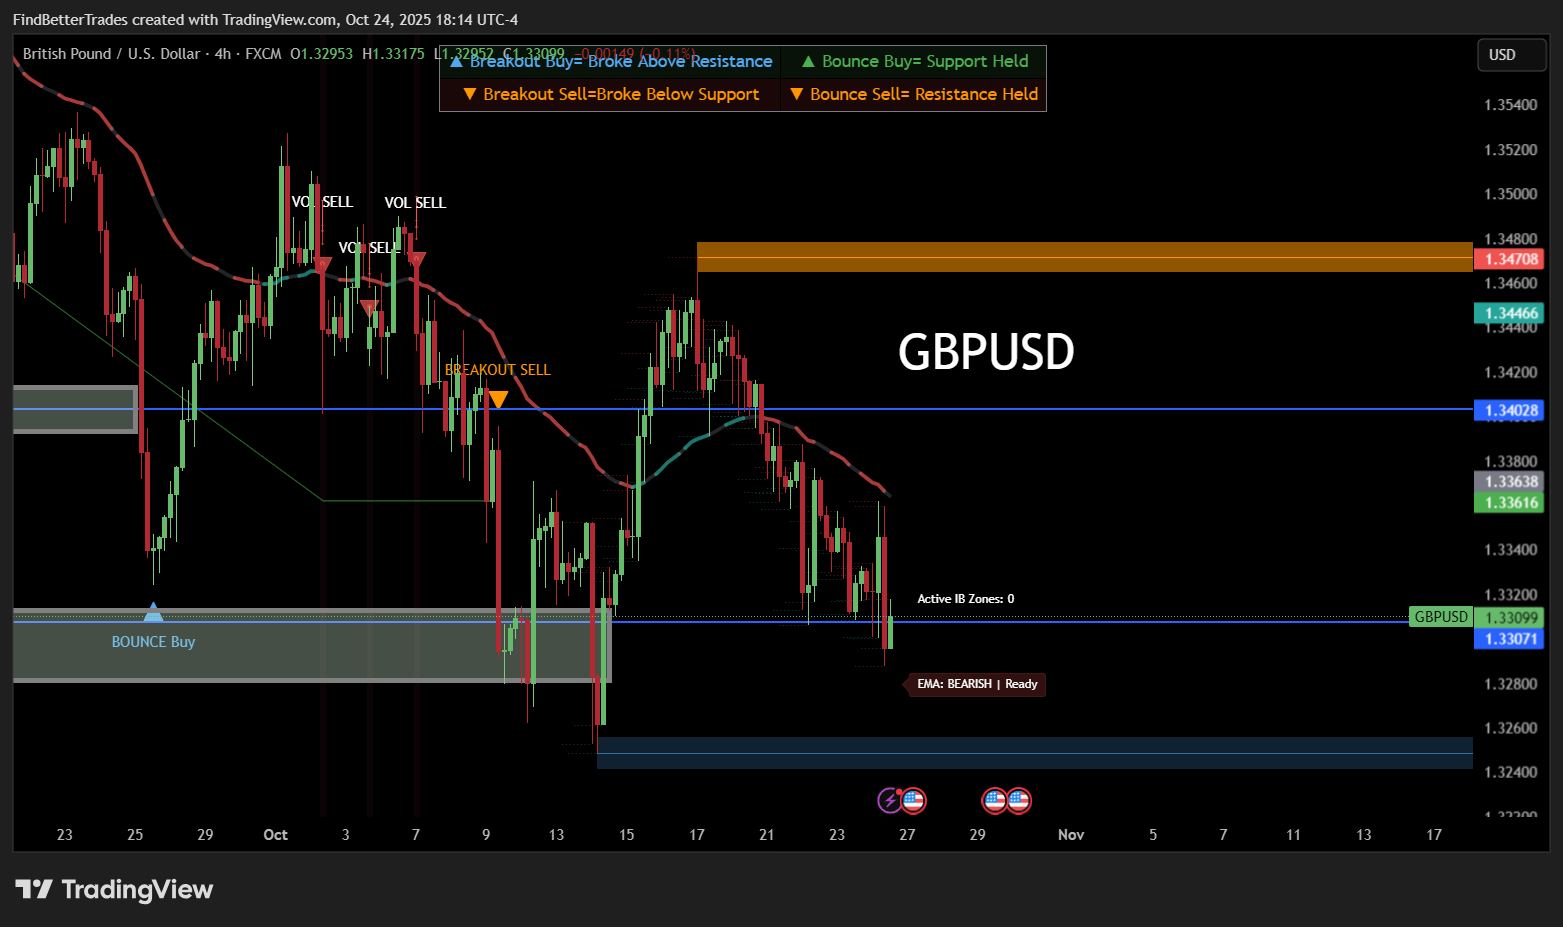
| Hey traders! This week, I want to dive into one of the most powerful concepts in institutional trading – bullish order blocks. The current GBPUSD chart provides us with a perfect example of how these zones create exceptional buying opportunities when price returns to test areas where smart money previously accumulated positions. Understanding Bullish Order BlocksBullish order blocks are specific areas where the last bearish candle before a significant bullish move occurred. They represent zones where institutional buyers placed large orders, absorbing all selling pressure and triggering the subsequent rally. Think of these blocks as institutional footprints – areas where smart money has demonstrated their willingness to buy aggressively, and they're likely to defend these levels on future tests. GBPUSD's Textbook Order Block SetupLooking at the GBPUSD chart, we can see multiple bullish order block zones marked in gray and blue. The most prominent appears around the 1.3260-1.3280 area, representing a zone where institutional buying interest emerged to halt the previous decline. Notice the "VOL SELL" signal at the top left and the "BREAKOUT SELL" signal, which marked the beginning of a significant bearish move. However, when price reached the lower order block zones, we saw dramatic reversals with strong bullish candles – this is classic institutional behavior. The sharp rejection from these order block levels, followed by sustained upward momentum, confirms these are legitimate areas of institutional interest that continue to attract buyers. Multiple Order Block ConfluenceWhat makes this GBPUSD setup particularly powerful is the presence of multiple order block zones creating layers of support. The blue zone around 1.3240 represents a deeper institutional level, while the gray zones show more recent areas of buying interest. This layered structure gives us multiple opportunities to participate in the upside move, with each order block acting as a potential entry point if price retraces. My Bullish Order Block StrategyWhen I trade these GBPUSD setups, I follow these principles: - Identify the last bearish candle before a significant bullish move
- Mark the high and low of that candle as the order block boundaries
- Wait for price to retrace back to test the order block
- Look for bullish rejection signals when price enters the zone
- Enter long positions with stops below the order block
- Target previous swing highs or resistance levels (like the 1.3470 area)
The key is waiting for confirmation that institutional buyers are still present at these levels. Current GBPUSD StructureWith Cable currently trading around 1.3300-1.3400, we're seeing how the bullish order blocks below have created a floor for this market. Any future pullbacks toward the 1.3260-1.3280 order block zone should be watched closely for potential buying opportunities. The orange resistance zone around 1.3470 represents a significant supply area where selling pressure previously emerged. This creates a clear target for long positions initiated from the order block zones. Reading the Downtrend StructureThe red descending trendline shows the previous bearish structure, but notice how price has broken above this trendline after bouncing from the order block zones. This combination of order block support and trendline breaks creates high-probability continuation setups. Remember, order blocks work because they represent areas where institutions have vested interests. When price returns to these zones, they often defend them aggressively to protect their positions. Until next time, let the order blocks guide your entries – they're where the smart money shows its hand! Trade smart, TradingStrategyGuides | 
Post a Comment
Post a Comment