Chris "CJ" Johnson, Lead Host & Senior Analyst, Monument Traders Alliance Publisher's Note: Did you catch our meet-and-greet interview with our new Senior Analyst and host of Monument Traders Live Chris Johnson in Monument Traders Live yesterday? If you didn't, you can watch the replay here. We'll be announcing details on next week's FREE training. Stay tuned! - Stephen Prior, Publisher
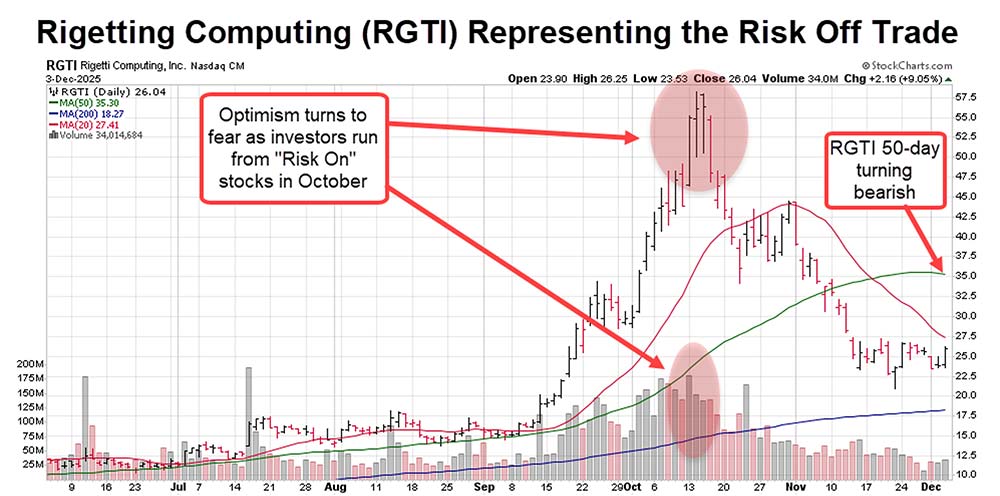
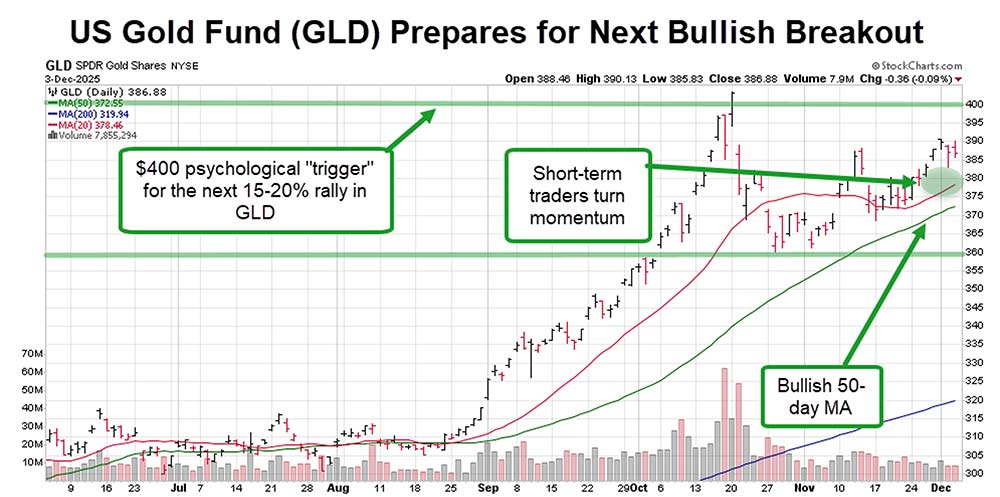
Dear Reader, Gold and the US Gold Fund (GLD) are preparing for what has become one of the most reliable rallies in the market over the last three years and there's a simple strategy to 10X its returns. Another strong rally in gold is building as investors and analysts wrestle with the idea that stocks are heading for a correction due to a potential bubble in the AI industry. Whether correct or not, those doubts are causing the first significant sentiment shift to a risk-off condition since the market's "Tariff Tantrum" in April 2024, a welcome development for the Gold Bugs. What is "Risk Off"? A risk-off situation in the stock market happens when investors ditch high-growth, high-risk assets and rotate into safe harbor assets. That money flies into "safe" assets like treasuries and gold. The move is usually triggered by fear, recession signals, geopolitical tension, Fed tightening, or a breakdown in market internals. Looking back over the last month, we've watched as the market has struggled to digest all these factors. The reaction to a risk off move is simple. Spike in volatility and defensive sectors like consumer staples and dividend yielding stocks take the lead. In short, it's a warning that the market is bracing for a larger impact. What Does This Mean For Stocks? In general, we've already seen a lot of damage from the shift to risk off. Industries like quantum computing, nuclear and eVTOL were all the rage over the summer as investors were in speculation – or risk on – mode. Names like Joby Aviation (JOBY), Oklo Inc. (OKLO) and Rigetti Computing (RGTI) more than doubled as investors saw opportunities to speculate on the next wave of opportunities in the market. The excitement seen towards these stocks was a bit of a warning sign from a sentiment perspective as investors tend to get "over their skis" with excitement near short- or long-term tops in stocks. You know, the whole Warren Buffett "Be fearful when others are greedy, and greedy when others are fearful" As is normally the case, the wild speculation turned to uncertainty in October as murmurs of an AI bubble shifted investor sentiment from speculative driven to safety. This led to the Risk Off trade engagement clearly notable in Rigetti Computing's chart below. As a result, stocks are now walking on eggshells as investors await the Fed's decision on December 10, but let's be frank… is the Fed going to save stocks right now? Not likely. What Does it Mean for Gold? A risk-off rotation is one of the strongest catalysts for gold. It forces capital out of high-beta assets and into vehicles with proven defensive strength. Gold benefits immediately: no counterparty risk, no balance-sheet assumptions, and historically strong performance during periods of tightening financial conditions. Add weakening dollar confidence, rising recession signals, and central-bank accumulation, and the risk-off flow becomes a structural tailwind. In short, when markets de-risk, gold becomes the trade. Gold's Technical Analysis Says a Breakout is Pending The technical backdrop for GLD remains firmly bullish as momentum, trend strength, and trader psychology are all aligned in favor of higher prices. The recent 10% drop reset short-term sentiment and brought shares back to key support at $370, not through it. Corrections like this are considered "healthy" and part of a long-term bull market cycle as short-term traders take the opportunity to lock in profits. We've seen five healthy corrections or consolidations over the last two years, each proving to be a short-term pause in what is otherwise the strongest long-term rally, tallying up more than 150% of gains since 2023. Here are the technical details: - 20-Day Moving Average ($377): GLD's 20-day moving average – what I refer to as the "Trader's Trendline" just turned bullish on November 25. This tells us that the short-term momentum is building towards a breakout.
- 50-Day Moving Average ($373): This trendline has been in a strong bullish trend since early September and has yet to waiver. Historically the GLD shares have a 67% chance of moving higher each day that the 50-day remains in its current trend. Vegas would kill for those odds!
- Volume Profile: Trading volume on the GLD shares is now increasing after a quiet period following the crescendo of activity at the October highs. This is another indication that the crowd is starting to accumulate gold-related investment again.
- Potential breakout price trigger ($400): Round numbers act as powerful support and resistance because traders anchor decisions around simple levels – example: "I'll buy it if it gets back to $50." We saw $400 act as resistance for the GLD shares in October, now a break through that psychological ceiling will trigger a new raly as investors chase prices even higher.
| 


Post a Comment
Post a Comment