You are a free subscriber to Me and the Money Printer. To upgrade to paid and receive the daily Capital Wave Report - which features our Red-Green market signals, subscribe here. The One Chart... "Chart Party..." (And the Week in Review)Sometimes you throw a party... the weather goes bad... and you're all by yourself... That's today's chart party...
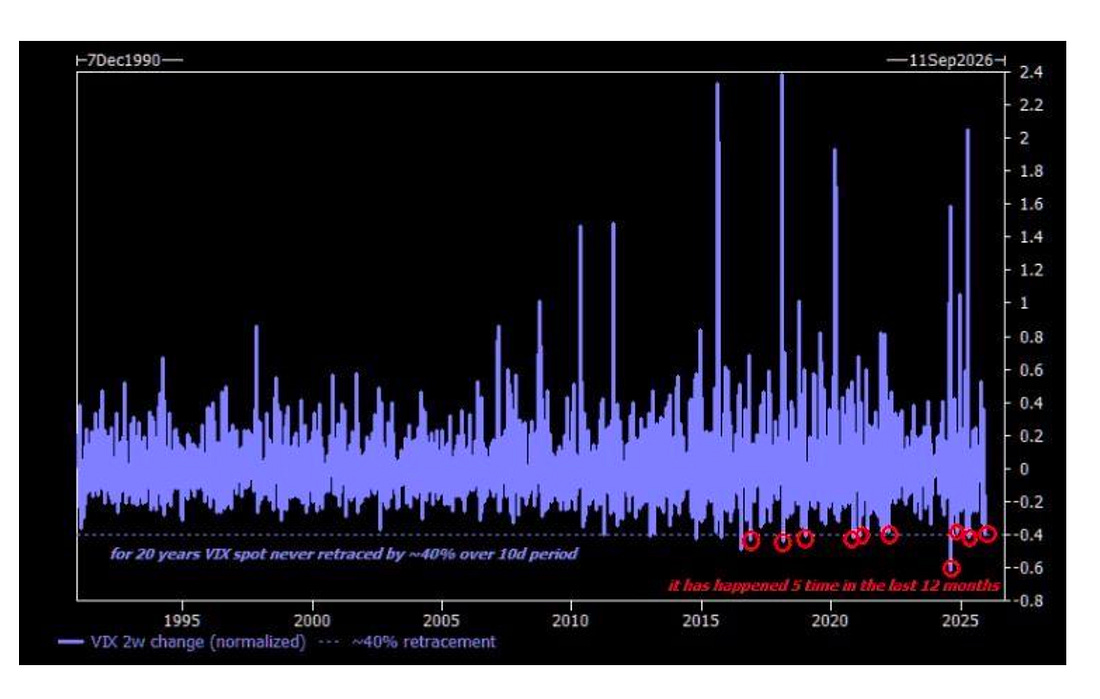
Dear Fellow Traveler: Have you tried mixing a muscle relaxant with financial charts? Last I slept funny, and the three protruding discs in my lower back… well… It’s been a nice day of card games with Amelia and watching the Bills game… We had a few inches of snow last night… and I’m realizing that I’ll likely be confined to this house over the next few days with more snow and ice along the way… So, plenty of time for reading… stretching… and charts. But… there’s only one chart that I want to show you today… because it’s another reminder of why Me and the Money Printer exists. Join us… A Chart Party of OneI opened a weekly report from Syz Group, and only one chart jumped out at me… It’s a historical chart of the S&P 500 Volatility Index. The VIX, the so-called fear gauge, measures how much volatility traders expect over the next 30 days, derived from S&P 500 option prices. When uncertainty rises, investors scramble for protection, bidding up options and pushing the VIX higher. When fear fades, it collapses. Simple enough. But here’s what isn’t simple… the chart below.
For roughly twenty years, from 1990 through around 2011, the VIX effectively never pulled back by 40% or more over a 10-day window in this dataset. Not during the dot-com bust. Not during 9/11. Not during the 2008 financial crisis. Now it’s happened five times in the last twelve months alone. (and it happened in August 2024 when the Nikkei crashed…) It’s also aligned with our rapid shifts in momentum readings that we track at the Capital Wave Report - and the big shifts in insider buying that have called temporary bottoms in the market…) What changed? Again… it didn’t happen before 2011… in a world that wasn’t dominated by… Policy. Specifically, the speed and frequency of policy pivots. Consider what markets have absorbed just since mid-2024… We’ve had coordinated stabilization efforts from Japan after the yen carry trade unwound, the Federal Reserve signaling liquidity availability through repo and standing facilities, the Bank of Japan softening hawkish forward guidance almost in real time, and the U.S. Treasury tilting issuance toward bills, reducing duration pressure, and preserving bank reserves. Each of these actions functions as a volatility circuit breaker. Fear spikes, the VIX surges, then a central bank opens a window or a Treasury official says the right words, and implied volatility collapses as fast as it rose. This isn’t a bug. It’s a feature of a market that now prices policy response as a near-certainty. The old regime looked like this… crisis, fear, slow resolution. The new regime looks like this… crisis, fear, policy pivot, rapid repricing. Rinse. Repeat. That’s why you’re seeing 40% VIX drawdowns measured in days, not weeks. The market has learned that policymakers will show up, and it is pricing that intervention directly into the volatility surface itself. This doesn’t mean risk is gone. It means volatility is now priced around expected intervention rather than organic resolution. Welcome to the new normal. This is why you should join us over at the Capital Wave Report where we live-track momentum, policy, insider buying, and liquidity shifts in the market… That’s how the world works now… Monday, December 8 What Do You Know? More Financial Fraud...Let’s break down a GAO report exposing massive fraud in expanded Obamacare subsidies, showing how automated payments without verification invite abuse.
The takeaway is blunt: when incentives reward enrollment and billing over oversight, fraud isn’t an anomaly. It’s the system working exactly as designed. Tuesday, December 9 Thesis Confirmed: What Really Drove the MarketOne Barclays chart exposes the last three years of market gains for what they really were… a liquidity-driven rally.
With valuations doing most of the work and earnings lagging, the piece explains why tracking financial plumbing matters more than earnings narratives. Wednesday, December 10 It’s Totally Not QE, You Guys. (A Rant.)On Tuesday, I broke down the Fed’s latest $40 billion Treasury bill purchases and why calling them “not QE” misses the point.
Framed as plumbing, the move is really about stabilizing funding markets and pre-loading liquidity ahead of stress. Semantics aside, the Fed just hit the liquidity button again. Thursday, December 11Don’t Fight The Fed... and Other Things I ThinkThe Fed’s latest $40 billion Treasury purchases quietly inject liquidity into the system. Here's why fighting that reality is a losing game.
The piece blends market plumbing, insider-buying signals, and personal perspective to show how money creation shapes prices, incentives, and long-term investing decisions. Friday, December 12 Happy Birthday, Monks...Friday, I stepped away from markets to reflect on entrepreneurship, parenting, and compounding in its purest form.
Using my daughter’s birthday as a marker, I tracked time, presence, and long-term investing together, showing why patience and consistency matter more than any single trade or forecast. Saturday, December 13 Postcards from the Edge of the World (Vol. 3)We unpacked the Fed’s new “Reserve Management Purchases” and what they really mean: money created at the top of the system to keep the funding machine stable.
Postcards connects the plumbing to real-life cost pressure, then lays out a practical “sovereign” response: owning scarce assets that a keystroke can’t dilute. All right… time to call it a day… We’ll catch up tomorrow… Stay positive, Garrett Baldwin About Me and the Money Printer Me and the Money Printer is a daily publication covering the financial markets through three critical equations. We track liquidity (money in the financial system), momentum (where money is moving in the system), and insider buying (where Smart Money at companies is moving their money). Combining these elements with a deep understanding of central banking and how the global system works has allowed us to navigate financial cycles and boost our probability of success as investors and traders. This insight is based on roughly 17 years of intensive academic work at four universities, extensive collaboration with market experts, and the joy of trial and error in research. You can take a free look at our worldview and thesis right here. Disclaimer Nothing in this email should be considered personalized financial advice. While we may answer your general customer questions, we are not licensed under securities laws to guide your investment situation. Do not consider any communication between you and Florida Republic employees as financial advice. The communication in this letter is for information and educational purposes unless otherwise strictly worded as a recommendation. Model portfolios are tracked to showcase a variety of academic, fundamental, and technical tools, and insight is provided to help readers gain knowledge and experience. Readers should not trade if they cannot handle a loss and should not trade more than they can afford to lose. There are large amounts of risk in the equity markets. Consider consulting with a professional before making decisions with your money.
|


Post a Comment
Post a Comment