You are a free subscriber to Me and the Money Printer. To upgrade to paid and receive the daily Capital Wave Report - which features our Red-Green market signals, subscribe here. What The Hell Did I Say on The Compound... And Our Saturday Chart Party...The people love it when a guy uses every financial word he knows in a sentence...
Dear Fellow Traveler: Never read the comment section, right? Well, I checked out a few from my conversation on Josh Brown’s show Tuesday… A lot of people have joined our community and reached out in chat after the show (welcome). Well, my favorite comment of the comments section is this...
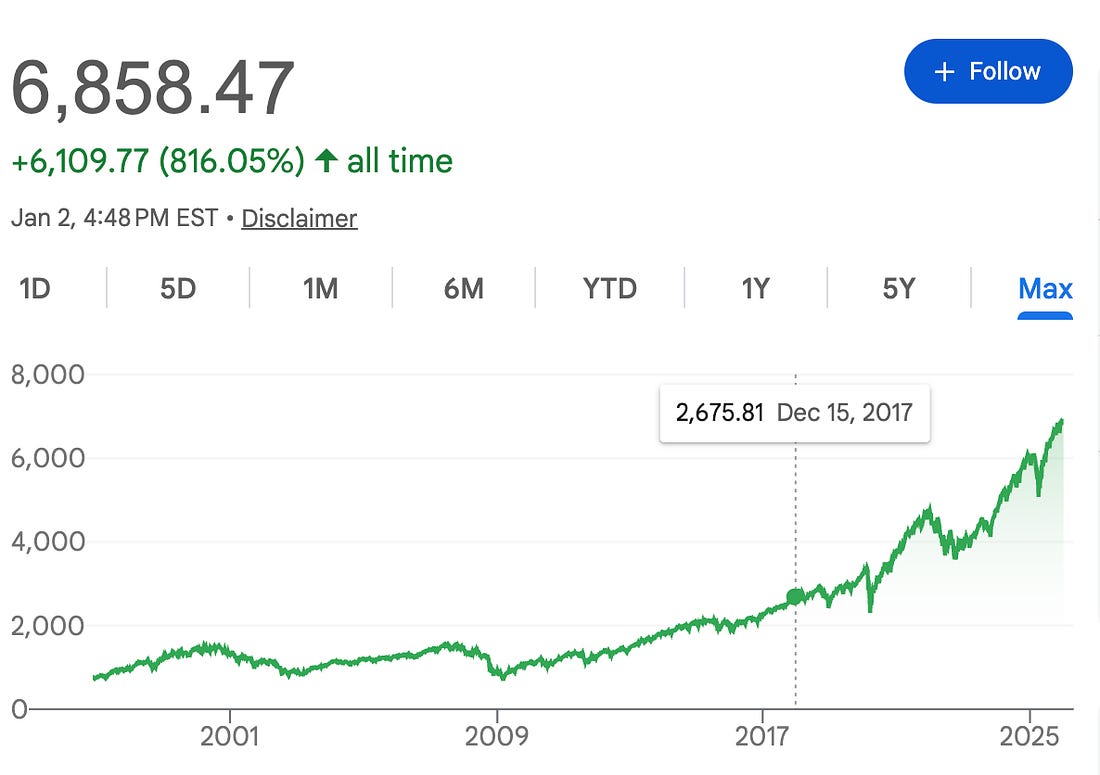
Hoo boy. Fair point! Somewhere between DayQuil and autopilot, I said a sentence that should’ve come with a translator. Look at this chart… The S&P 500 is up 146% since the start of 2018 (160% with dividends)… while U.S. Gross Domestic Product is up just 48% over the same period.
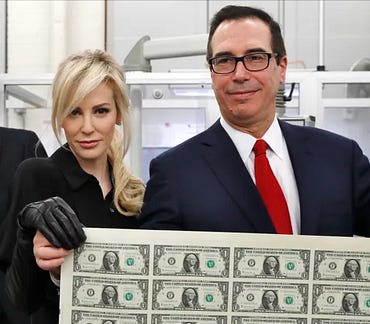
That doesn’t line up… does it? Isn’t the stock market supposed to be some incredible reflection of American economic strength? Well… no… not at all… That lingo I gargled that sounds like it came out of a fever dream… explains the S&P 500’s surge since 2018 until today… Are you ready? I’m actually going to explain what the hell I just said on Tuesday. It’s really, really important. What most people don’t realize is that how the government borrows matters just as much as how much it borrows. The Government Has a Credit Card ProblemTo understand how this market works, you must understand U.S. borrowing practices. The U.S. government spends more than it collects in taxes. That gap is called the deficit, and it has to be financed by borrowing. Treasury does this by selling IOUs called Treasury securities. Think bonds, notes, and bills. They’re all just government debt with different maturities (the dates when the final payment is due and the principal is returned). The distinction matters only because of how they behave within the financial system. The U.S. Treasury has choices about how to structure that borrowing. They can sell 30-year bonds and lock in a rate for three decades. Or they can sell short-term T-bills that mature in a few weeks or months. Think about buying a car. You could finance it over 6 years with a fixed payment. That’s stable, predictable, and set up on day one. Or you could put the car on a credit card and just pay the minimum each month, letting the balance roll over. When a 3-month T-bill comes due, Treasury doesn’t actually pay it back. They issue a new T-bill to replace it. (Called: Rolling over.) The debt rolls over, and the agency kicks the can down the road. For a long time, the consensus was that the government should fund itself largely with longer-term debt. They could lock in lower rates and ensure we weren’t constantly rolling over short-term borrowing… But starting around 2017, that approach shifted dramatically. In December 2017, Congress passed the Tax Cuts and Jobs Act. Corporate rates fell from 35% to 21%, and individual rates slumped across the board. Whatever you think about the policy, one thing was mathematically certain. The government was gonna collect a lot less revenue… to the tune of trillions in revenue over a decade. Where does that money come from? Well… that’s where Treasury “issuance” comes in… They could issue a bunch of long-term bonds…. but that creates a problem. The bond market is like any other product in a market-based system. It operates on supply and demand. If you pump too many long-term bonds into the market, and there aren’t enough buyers, the value of the bonds drops, and the yields (or interest costs) go up. Again, when bond prices drop, interest rates rise. They move in opposite directions. So if the Treasury flooded the market with long-term bonds, long-term interest rates could spike if there weren’t enough buyers. And that creates problems elsewhere in consumer and business finance. Mortgage rates are tied to the 10-year Treasury. Corporate borrowing costs follow long-term rates. Higher long-term rates would tighten financial conditions across the entire economy at a moment when the first Trump administration was trying to juice the economy with tax cuts. So Treasury made a tactical decision. Secretary Steven Mnuchin, [below with his wife in a picture that gives me the heebie-jeebies], funded the deficit with short-term T-bills instead.
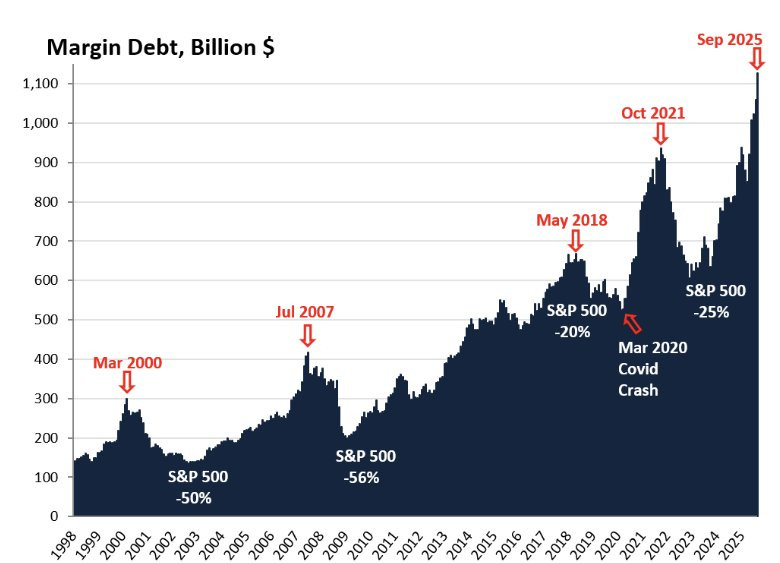
Munchin kept the long-term bond market from flooding and mortgage rates from spiking. It was clever, and it worked. His successors Janet Yellen and Scott Bessent have kept that tradition going… But this decision to keep the foot on the gas at the front end of the curve has had consequences that many people don’t understand, including its impact on the stock market’s incredible surge relative to GDP since 2017... Short-Term Debt Acts Like Real Money in FinanceIf you take nothing else away from this, take this one idea with you… A 30-year Treasury bond is an investment. A 1-month T-bill is NOT. On the 30-day bond, its price bounces around based on interest rates. If rates go up after you buy, your bond’s value falls… If you need cash tomorrow, you might have to sell at a loss. (This issue was a driver of the Silicon Valley Bank Crisis.) A 1-month T-bill is completely different. You’re getting your money back in 30 days. The price barely moves. Any bank or money market fund can hold this thing and treat it almost like “cash.” Long-term bonds are investments. Short-term T-bills are basically cash that happens to pay a little interest. When the Treasury floods the market with T-bills, it’s not just borrowing money. It’s adding “money-like instruments” to the global financial system. And cash is the grease that makes the investment world run. The Real Plumbing of Wall StreetNow I’m about to explain the repo market. This is the beating heart of the whole freaking thing. All of it… finance itself. “Repo” is short for repurchase agreement. Don’t let the name fool you. Repo is basically a pawn shop for Wall Street. You likely know how pawn shops work… If not… It’s simple. You need cash today. So you bring in your guitar to a pawn shop. The pawn shop gives you $200 and holds your guitar. You agree to come back in 30 days, pay them $210, and get your guitar back. That extra $10 is their fee. If you don’t come back, they keep the guitar (and sell it). The repo market works exactly the same way, just with Treasury securities instead of guitars and billions of dollars instead of hundreds. So, let’s say that a bank needs cash overnight. They “sell” their Treasury securities to another bank and agree to buy them back the next morning at a slightly higher price. The Treasury securities are the collateral, like the guitar at the pawn shop… Banks use the repo market constantly. It’s how banks manage cash day to day. If they have too much cash, they lend it to repo and get Treasuries in return, which can be sold quickly at an expected value or held to maturity. Need cash? Borrow in repo using your Treasuries as collateral. The entire repo market runs on collateral. And nothing is better collateral than short-term Treasury securities. A T-bill is the perfect pawn shop item. Everyone knows exactly what it’s worth. There’s no risk. So when Treasury issues an ocean of T-bills to fund the tax cuts (or any other U.S. deficit), they’re giving the repo market more collateral to pawn… which is more fuel… to get more cash. The Magic of RehypothecationNow here’s where the lingo gets intense… This is what I was babbling about with the sinus medication. Rehypothecation… Don’t worry, I’ve written about it before… and it’s insane… Remember our pawn shop? So imagine the pawn shop takes your guitar… but then that person who gave you $200 immediately pawns it at another pawn shop across the street. And then that pawn shop pawns it at a third location. Your one guitar is now collateral for three simultaneous loans. Sounds sketchy, right? No shit… But our entire financial system is built around this concept. This process is rehypothecation. In essence, the same collateral is pledged multiple times. Bank A pledges a Treasury to borrow from Bank B. Bank B takes that same Treasury and pledges it to borrow from Bank C. And Bank C pledges it to Bank D. One Treasury security might support three, four, or five different loans as it gets passed around. This is how the financial system creates credit without the Fed printing new money. This is how margin debt explodes over time…
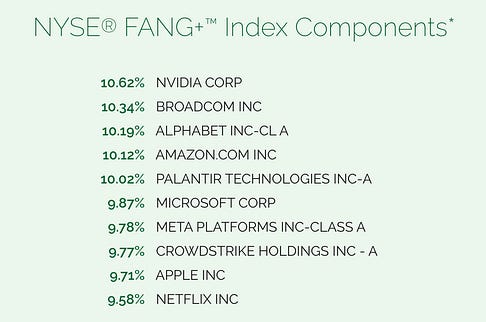
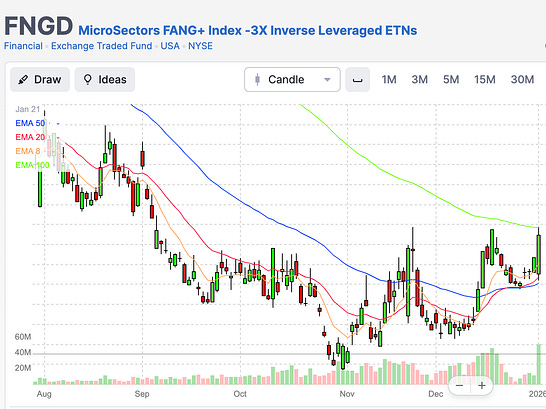
It’s a money multiplier built into the plumbing… When Treasury adds more T-bills to the system, the effect gets amplified. Just in case you need a drink early today… research estimates that a “US treasury is reused seven times on average” via repo markets or similar transactions. Now Follow the Money to the Stock MarketWhen you’ve picked yourself off the floor after smashing your head into the desk on that little fact… let’s make it better. Let’s connect the dots of this clown festival we call the American financial system. We start with the Treasury issuing tons of short-term debt to fund the tax cuts. That debt acts like cash in the financial system. Banks use it as collateral in the repo market. Through rehypothecation, each dollar of collateral supports multiple dollars of borrowing. Here’s what really matters: Where does that borrowed money go? It goes into assets. It flows into stocks, corporate bonds, real estate, and any asset that offers a return. A hedge fund can now borrow more easily in the repo market. What do they do with that borrowed money? They buy stocks, mostly. So do the bank trading desk and all the leveraged players. More borrowing capacity means more buying power. “It’s a big club… and you ain’t in it…” said George Carlin. And your money… your paycheck… competes against this borrowed money to purchase those assets as they continue to rise and rise… This is what I meant by “valuation expansion.” Prices go up because there’s more money chasing the same stuff. You didn’t need companies to get more profitable. You just needed more money to show up and chase stocks higher. The Double StimulusThink about what actually happened in 2017 and 2018. Two powerful forces hit the stock market simultaneously. First, the corporate tax cuts themselves. When you slash the corporate rate from 35% to 21%, companies instantly become more profitable after tax. If a company made $100 before taxes, it used to keep $65. Now they keep $79. Earnings went up mechanically, even if the business didn’t change. That alone justifies higher stock prices. Second, the way the Treasury chose to fund those tax cuts. By issuing short-term debt instead of long-term bonds, they pumped liquidity into the repo market. That liquidity flowed into asset prices. Tax cuts made earnings go up. The financing of those tax cuts made the money available to bid up stock prices. It was a double stimulus... and few people connected these two dots. The tax cut debate was about jobs, growth, and fairness. Nobody was talking about T-bill issuance or repo-market collateral. But that plumbing, in my view, mattered more than the tax policy itself… People don’t understand monetary policy and Treasury policy because it’s boring and complicated… I’ve watched Members of the U.S. House Committee on Financial Services ask acting Federal Reserve officials questions about the state of the repo market, and I’m not even sure the interviewer or the Fed official understands the real problems are… and if you need something to fall asleep to… this video is it. Meanwhile, people have plenty of opinions about fairness and taxes… and everyone understands the mantra of “Tax the Rich” or “Don’t Tread on Me.” All that stuff makes for debate shows and cable network talking heads that don’t understand a thing about monetary policy or economics in general. It also fuels a chorus of illiterate politicians who can sell themselves as champions of business or of the working class. And that’s all complete and total bullshit… It’s “theater.” The most powerful forces shaping asset prices today rarely show up in political debate at all. We argue endlessly about fairness and taxes, while the real leverage sits in issuance calendars, collateral policy, and repo plumbing that few ever discuss… So What Does This Mean for You?If you’re looking at the stock market and thinking “this doesn’t make sense given the economy,” you’re not wrong. Valuations are stretched, and the economy has had its wobbles. But asset prices are driven more by liquidity than by fundamentals in today’s world. All money has to go somewhere, and so long as the Treasury keeps the short-term debt spigot open and the repo market keeps humming, there’s a bid under risk assets. And they will. In 2017, about 11% of U.S. debt was issued in short-term bills. Reuters says the figure climbed to about 22% by late 2025, and Bank of America predicts it could reach 25% in the years ahead. That’s rocket fuel for the equity market... This doesn’t mean stocks can only go up. It means you need to watch the plumbing, not just the headlines. We must watch Treasury issuance, repo rates, and stress… I don’t really care about Jerome Powell’s speeches. When Treasury changes its issuance strategy, when the repo market gets stressed (like it did in September 2019 and in the last few months, but that’s another story), that’s when you must pay attention. That’s why we have a momentum signal that focuses on stress… and that’s why we watch very important charts… to know if something is wrong in the plumbing and if leverage could unwind quickly in this financial system. We’ve been ahead of every major downturn and stress event over the last five years… All of this is what I was trying to say on Tuesday. This time, without the DayQuil. Now… let’s get to some charts… including the one you must watch when there’s stress… Chart No. 1: “The F’n GD, Man” - @SecretAgentCharlieFNGD is a -3x inverse leveraged ETN tied to the NYSE FANG+ Index from MicroSectors. An Exchange-Traded Note is an unsecured debt security issued by a bank to track the performance of a market index, commodity, or investment strategy. Here’s what the FANG+ Index tracks over at MicroSectors…
That means for every 1% that FANG+ falls in a day, FNGD aims to rise by about 3% that same day through derivatives and swaps.
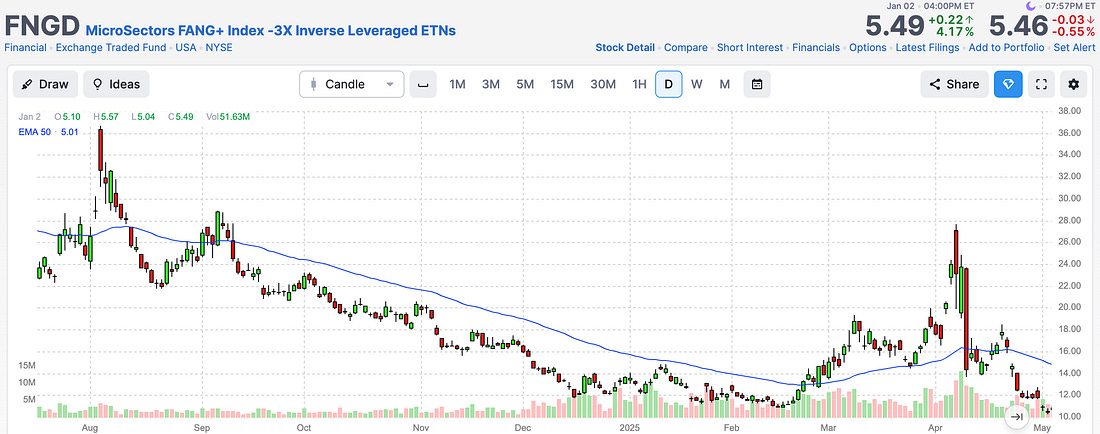
Because FNGD is -3x inverse, it does not trend higher on one bad day in tech. It only sustains upside when declines in mega-cap stocks are continuous… the losses have to be stacked across multiple sessions. Continuous, stacked selling implies margin pressure, volatility-triggered selling, passive outflows, and dealer hedging that are all reinforcing each other. This is not a healthy pullback. In a liquidation phase, the market sells what it can sell. The biggest, most liquid stocks go fast (usually after Treasury bills) because they function as collateral, not just investments. Just like in repo markets, hyper-liquid assets get pledged, rehypothecated, and unwound fastest when funding tightens. Yep, the rules apply to mega-cap tech just as much as they do to bonds. Associating these moves with liquidation matters. It distinguishes forced selling from rotation… as evidenced by huge spikes in August 2024 and April 2025. Above the 50-day EMA, FNGD is signaling that capital is being pulled, not repositioned.
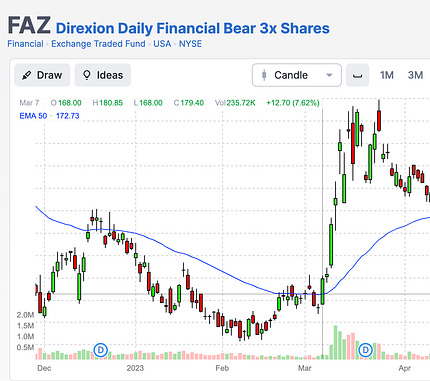
One hard-earned rule…. remember that nothing good happens when FNGD is trending above its 50-day EMA. And the stress showing up there has already been visible in the repo markets for weeks. There’s been some weird price action in recent days on Amazon, Palantir, and Netflix. This is all interconnected… Chart 2: Don’t Forget The FAZ! -Oh yeah… so while the FNGD is for FANGS… MicroSectors has the BNKD - an inverse -3X ETN around banking stocks. The problem is that this chart doesn’t go back far enough. So… you can also watch the -3x Inverse ETF for banks called the FAZ… Not every major selloff is led by the MAG7 stocks… so tension can come from elsewhere. There are two types of equities. Financials… and non-financials. My momentum signal went negative on March 7, 2023. I had no idea why… During the Silicon Valley Banking Crisis… the FNGD barely moved… because no one was dumping FAANG stocks. That was a reserves crisis… and all hell broke loose on March 7 as the FAZ broke out… and banks collapsed days later…
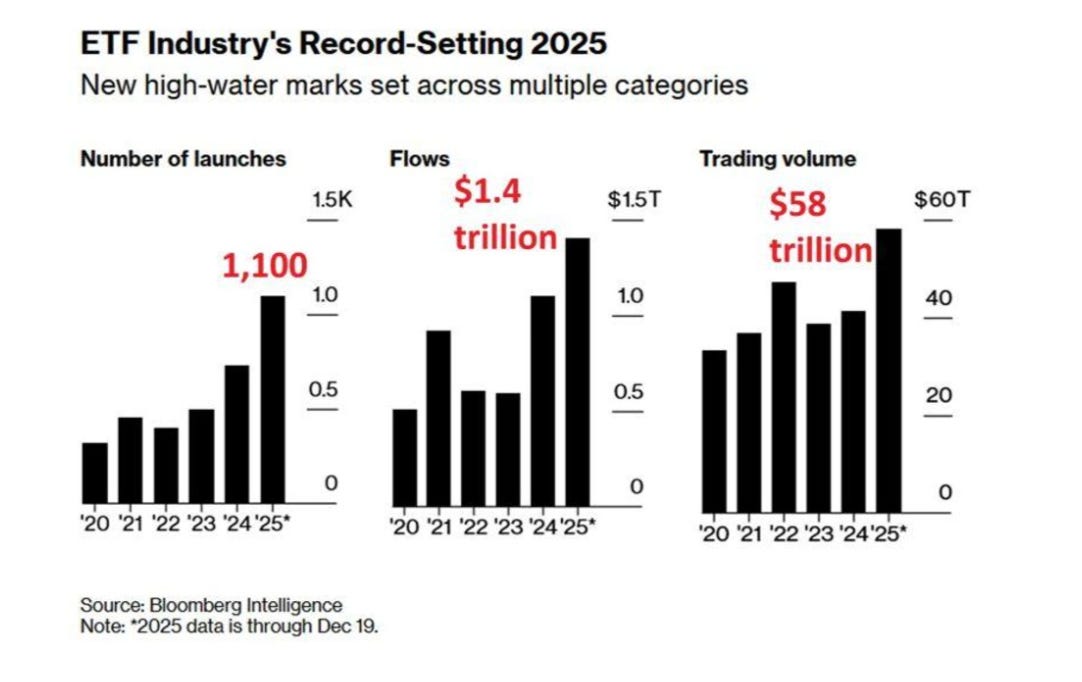
Always watch the FAZ and the FNGD… there’s a story in both charts if they break out… and that story ends up in a Reuters article six days to two months later… There was no warning about any banking crisis or problems in regional banks BEFORE March 7, 2023… the day our signal went negative. A few days later, Silicon Valley Bank was gone. Things show up in price well before the journalists show up… Watch the flows and signals like a hawk. We do it every single day… Chart 3: Follow the IncentivesThere are now more ETFS in the U.S. (4,902) than actual stocks (4,228). Why? Incentives. Last year, we hit a new watermark across all ETF categories, according to Bloomberg.
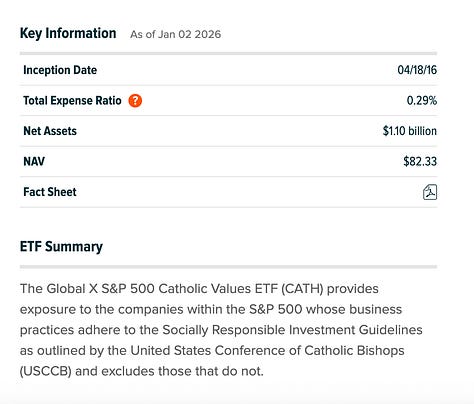
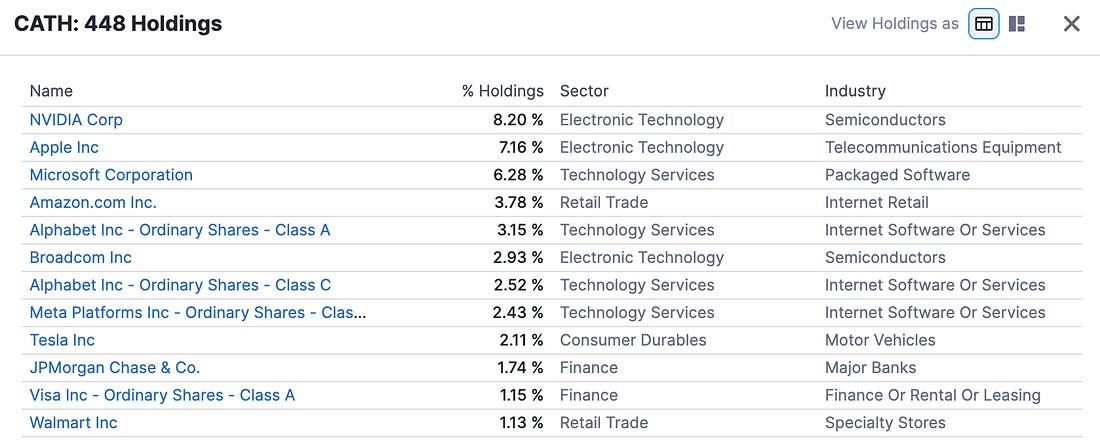
Passive investing flows account for more than half of the capital flowing into the market. The pensions and retirees want them to do well… but the people making these ETFs get money from lending shares and also expense ratios. Why manage a “2 and 20” fund when you can collect 0.29% on as the manager of the “Catholic Values S&P 500 ETF,” an ETF that really just mirrors the performance of the SPY (which has an expense ratio of just 0.09%).
After all… 0.29% of $1.1 billion is about $3 million a year… What are they doing to justify 20 basis points on the SPY? Selling plenary indulgences through clever marketing? Seriously… look at this portfolio…
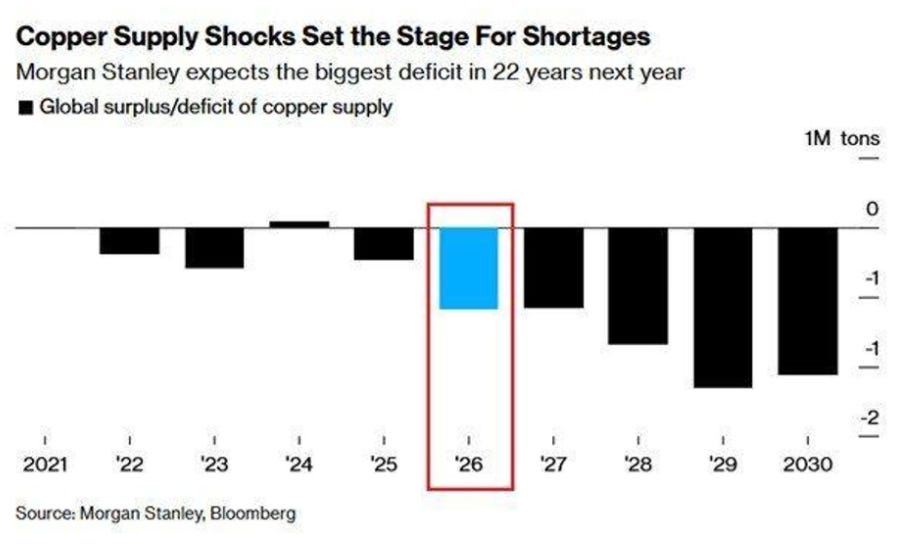
The only thing about this ETF that is “Catholic” is its 0.59% exposure to Home Depot (HD)… because Jesus of Nazareth was a home builder… Chart 4: Here Comes ChinaJust a reminder… Check out Michael Howell’s 2026 update on monetary inflation and China’s coming liquidity boom. His data shows that Quantitative Easing out of China has a positive development for materials and energy prices… like copper and oil. With a copper shock already underway… and China primed to support their manufacturing economy… look out… Things could get a lot more interesting…
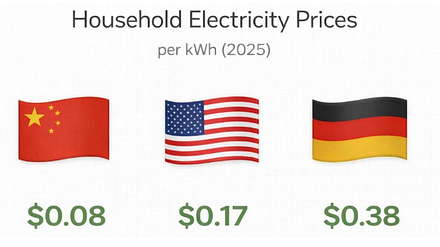
Copper mining stocks work… and so do piping companies. Scott and I were long Mueller Industries Inc (MLI) in our 2025 annual outlook (it was up 44% last year), and we remain confident in it again in the year ahead. So do 1-to-1 trusts in the physical metal like the Sprott Copper Trust (TSX COP.U) if you can get access… If you missed our 2026 Outlook… It’s right here. Chart 5: And Finally… How Are We Going to Win On Energy? The U.S. and China are on different paths on energy costs. The SYZ Group chart of the week showed this image… from Pius the banker…
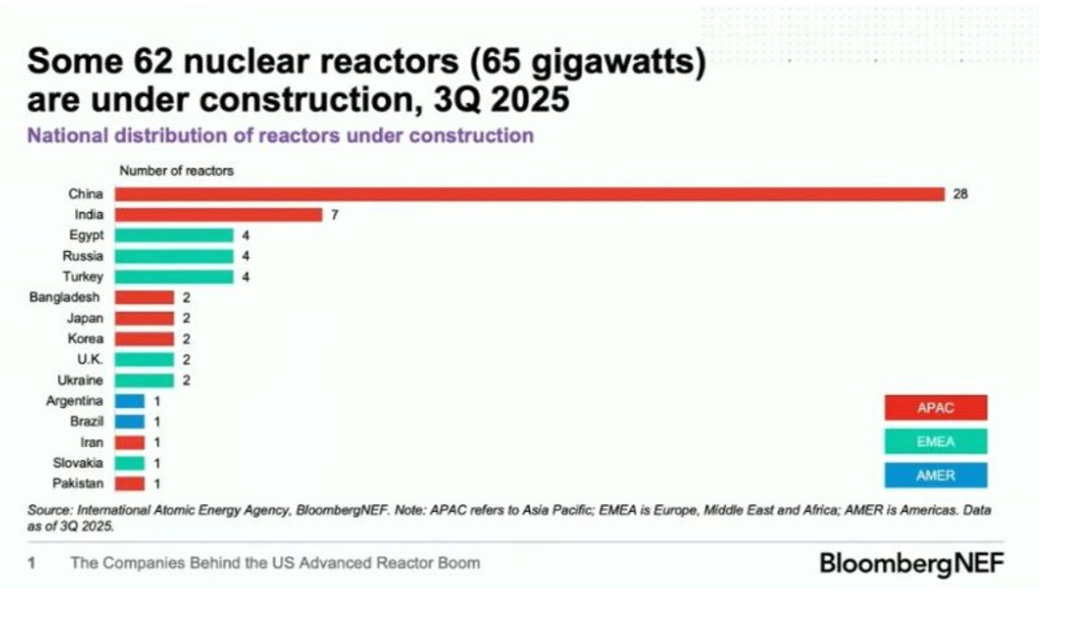
Yes, China has used state programs to keep those household costs down, but this is a story about three nations… Germany is lost… the U.S. Well… there’s still time. But this chart really asks a question. How serious are we about energy… the backbone of civilization and the driver of innovation?
The U.S. has no nuclear reactors under construction… And China has nearly half of the 62 currently under construction. Yes, we have the dream of mass-scale geothermal out West… but that is still in development. I have to ask… do half our politicians care, and do the other half understand? Win the energy race… win the future. I’m heading to the bowling alley with my daughter for the day… I trust you’ll all behave. Stay positive, Garrett Baldwin Source: Maurin (2022), Journal of Financial Intermediation. About Me and the Money Printer Me and the Money Printer is a daily publication covering the financial markets through three critical equations. We track liquidity (money in the financial system), momentum (where money is moving in the system), and insider buying (where Smart Money at companies is moving their money). Combining these elements with a deep understanding of central banking and how the global system works has allowed us to navigate financial cycles and boost our probability of success as investors and traders. This insight is based on roughly 17 years of intensive academic work at four universities, extensive collaboration with market experts, and the joy of trial and error in research. You can take a free look at our worldview and thesis right here. Disclaimer Nothing in this email should be considered personalized financial advice. While we may answer your general customer questions, we are not licensed under securities laws to guide your investment situation. Do not consider any communication between you and Florida Republic employees as financial advice. The communication in this letter is for information and educational purposes unless otherwise strictly worded as a recommendation. Model portfolios are tracked to showcase a variety of academic, fundamental, and technical tools, and insight is provided to help readers gain knowledge and experience. Readers should not trade if they cannot handle a loss and should not trade more than they can afford to lose. There are large amounts of risk in the equity markets. Consider consulting with a professional before making decisions with your money.
|


Post a Comment
Post a Comment