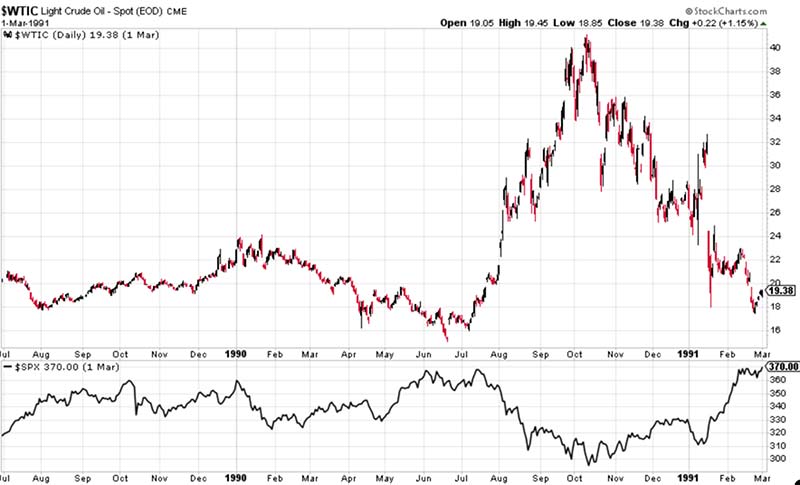
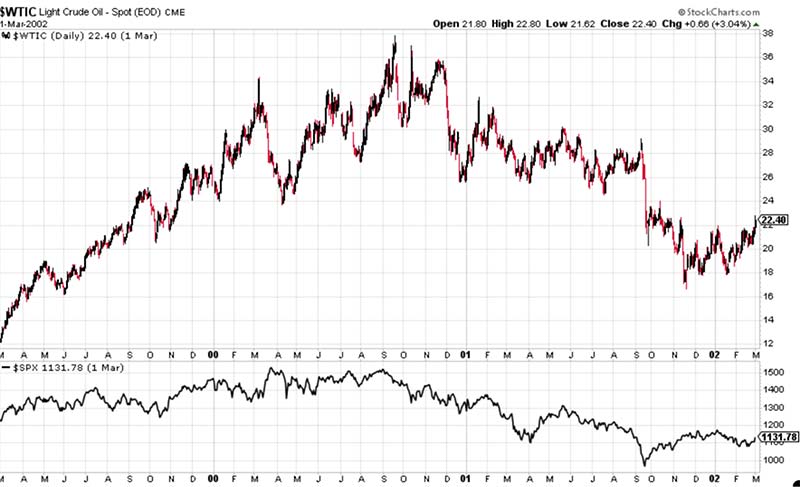
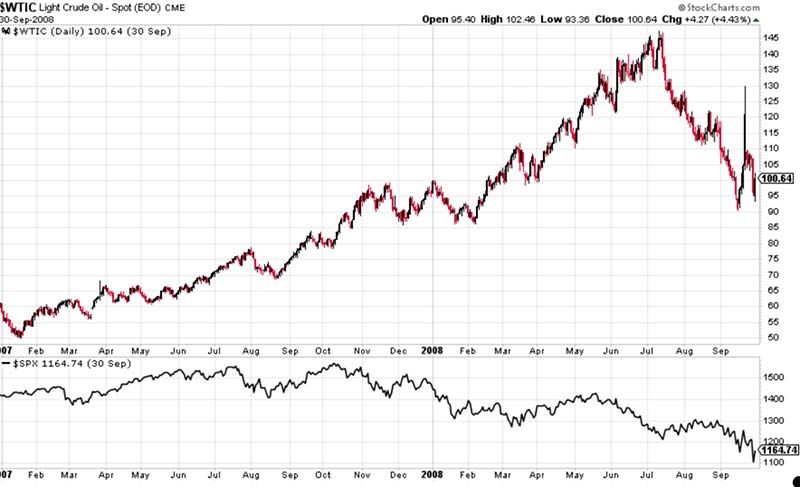
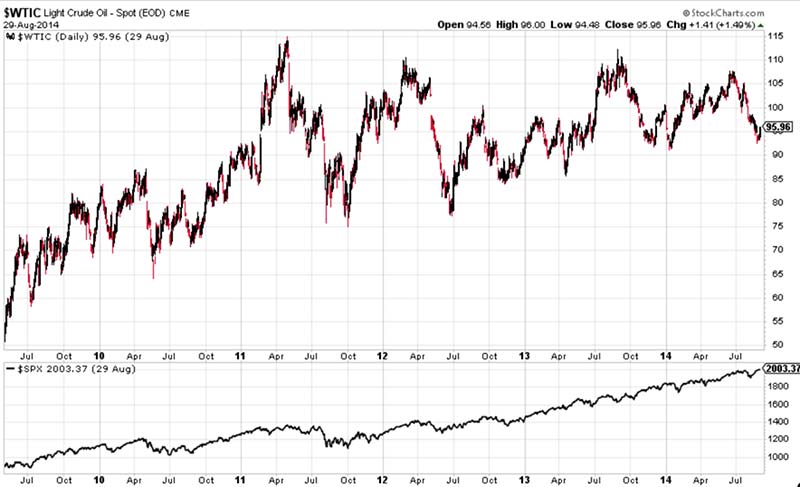
| Energy has been the story in the markets for at least the past year. Prior to last week, when investors talked about the energy sector, it was in relation to how it would feed AI. But now, because of the war in the Middle East, the main topic on everyone's mind when it comes to energy is the surge in oil prices. On February 20, I told readers in my Technical Pattern Profits VIP Trading Service that if oil got above $65, it was likely going to $80 quickly - and after it reached $80, I said it would go on to $95. Yesterday, just 17 days after my initial prediction, it crossed $100. There have only been three times in the past 44 years that oil has spiked above $100 per barrel. It happened in 2008, from 2011 to 2014, and in 2022 coming out of the pandemic. Oil is back down in the low $80s as I write, but it's still markedly higher than the mid-$50s prices we saw near the end of last year. That obviously causes pain at the pump and raises inflation, as everything gets more costly to ship. But what does it mean for stocks? Let's look at five previous periods when oil spiked. In 1990, when Iraq invaded Kuwait, oil prices quickly doubled from around $20 per barrel to more than $40. You can see that during that move in oil, the S&P 500 had a nearly identical inverse reaction. Nine years later, as the dot-com boom was entering its final phase, oil surged from about $10 per barrel to nearly $40 a year and a half later. Interestingly, as oil rose, the S&P - caught in the final throes of dot-com mania - did not slide immediately. In fact, it continued to rise even though the rally was clearly running out of gas (pun intended). Then, just as oil peaked, the market began its plummet. | 


Post a Comment
Post a Comment