Hey guys,
Did you see that massive V-shaped recovery on the SPY today?
The market opened deep in the red as the news from the Middle East sent the "war worry" algos into a frenzy.
But look at what's happening right now...
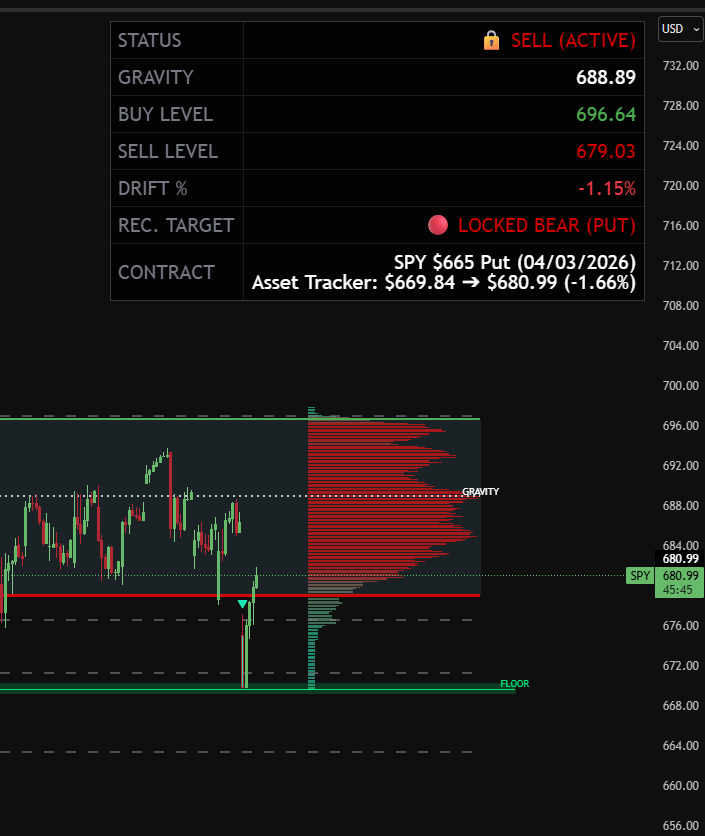
SPY is trading right now at $680.99, clawing back almost everything it lost this morning.
If you look at the chart above, you'll see exactly why this happened through the lens of the Gravity Zone.
Notice that White Dotted Gravity Line up at $688.89?
That is the high-volume equilibrium—the place where the market "wants" to be.
When the news hit, the price "jumped out" of the Gravity Zone, crashing through the Red Trap line ($679.03).
It got pushed all the way down to a "Floor" near $670, creating a Drift of -1.15%.
Think of that Drift % like a rubber band being pulled tight.
The further the price moves away from that White Dotted Gravity Line, the harder the system wants to snap it back to the center.
That's exactly what we're seeing in this recovery.
While everyone else was panicking about headlines, Gravity Zone users could see the price was simply overextended.
The "Sell" status is active, but the rubber band effect is what drives the intra-day rip.
This tool helps you cut through the "fog of war" and see where the actual institutional volume lives.
Stop guessing which way the headlines will push the market and start trading on the same side as the algorithms.
Get the Gravity Zone and see the market's true center of mass right now.
Best,
Ben
Find Better Trades
Post a Comment
Post a Comment