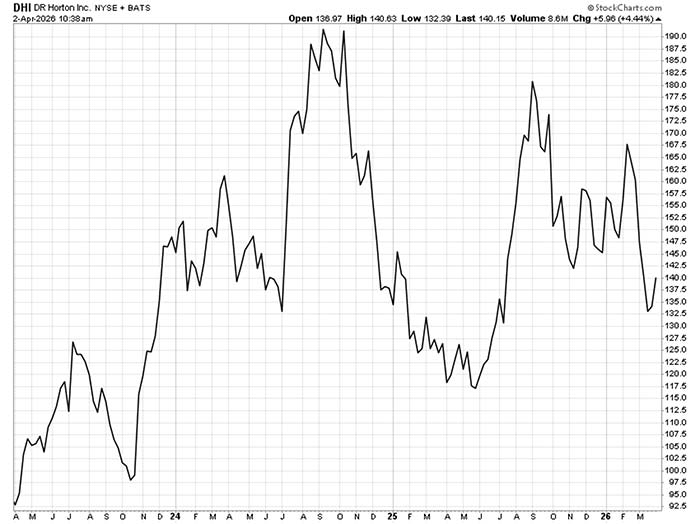
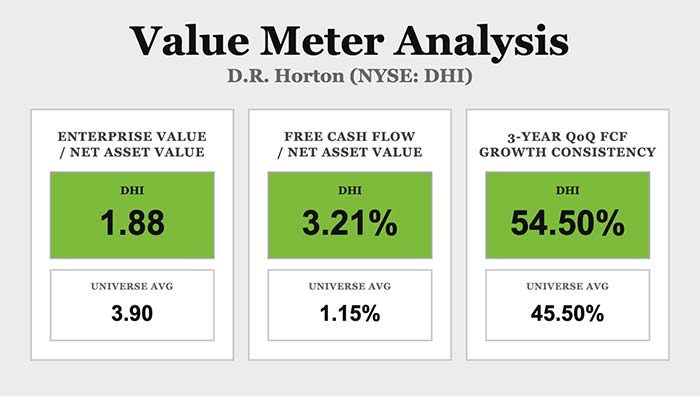
| The market is pricing affordability headwinds in the housing sector as potentially crushing to operators across the industry. And it's pricing one company in particular as though those headwinds will define its future indefinitely. But as we'll see shortly, that is not what the cash flow record shows. D.R. Horton (NYSE: DHI) has been the largest homebuilder in the United States by volume since 2002. The company operates in 126 markets across 36 states, building homes from entry-level to move-up price points, alongside its rental housing, lot development, and mortgage services businesses. For the fiscal first quarter (which ended on December 31), D.R. Horton posted revenues of $6.9 billion, down 10% from $7.6 billion a year earlier, and net income of $594.8 million, down 30% from $844.9 million. Cash from operations totaled $854.0 million. Net sales orders rose 3% year over year to 18,300 homes - a signal that demand, while squeezed by mortgage rates and cautious buyers, has not stalled. The company also returned $801.2 million to shareholders through buybacks and dividends, ending the quarter with $6.6 billion in total liquidity against $5.5 billion in notes payable. The stock peaked near $190 in mid-2024 and again near $180 in the summer of 2025 - two attempts at the same ceiling, neither of which held. The stock spent the back half of 2025 and the opening months of 2026 giving back most of those gains, falling to around $130 before the current recovery. At $140, it is still roughly 25% below those highs. Price action like that reflects a specific thesis: that the business is more vulnerable to the rate environment than its financials suggest. The Value Meter looks past that thesis and focuses directly on the numbers. What it finds is worth examining. D.R. Horton's enterprise value is 1.88 times its net asset value, roughly 52% below the broad market average of 3.90. A discount of that size does not reflect indifference. It reflects a market assigning a risk premium that the company's own balance sheet does not justify. Buyers at today's price are effectively acquiring $1 of assets for around $0.48. The company's quarterly free cash flow relative to net asset value is 3.21%, compared with a broad market average of 1.15% - nearly 180% above average. That gap has a practical consequence: A business generating cash at that rate while priced at a steep discount is compounding its margin of safety - the difference between the intrinsic value of the business and its lower market value - quarter by quarter. Furthermore, over the past three years, D.R. Horton's quarterly free cash flow has grown sequentially about 55% of the time, against a broad market average of about 46%. That is not a streak of fortunate quarters. It is a result of the company's business model sustaining positive cash flow momentum across rising rates and uneven demand. For an investor entering at a significant discount, that consistency matters. Even if conditions take a while to improve, the downside for the stock remains manageable. One quick note: A reader named Timothy recently asked me whether The Value Meter's "universe averages" are based on industry competitors or the entire market. The answer is the latter. Most analysts, for good reason, tend to compare individual companies with firms that have similar business structures, incentives, tailwinds, headwinds, etc. By doing so, they can determine a company's relative position against its peers. The Value Meter, however, offers a bird's-eye view. It's telling us something broader about the market and about the stocks it analyzes. Considering the cash flows the company generates, is its acquisition cost really that worthwhile? That question is not just a matter of the stock's value against peers. It's about comparing the stock with an entire market full of other potential opportunities. So... how does D.R. Horton stack up against the rest of the market? | 


Post a Comment
Post a Comment