-->

This Chart May Make You Uncomfortable

Post a Comment
Shield

AN OXFORD CLUB PUBLICATION

Loyal reader since October 2021

Wealthy Retirement

Editor's Note: Below, Director of Trading Anthony Summers discusses the market's current valuation and why small caps look like a better value than large caps right now.

Speaking of small caps...

Chief Investment Strategist Alexander Green was digging through Apple patents recently when he discovered something extraordinary.

In short, he believes he's uncovered Apple's next major disruption. He calls it "Project Orion."

And September 9 could be the day Apple reveals everything.

He says one tiny partner's stock could soar higher when the news breaks.

Click here to learn more.

- James Ogletree, Senior Managing Editor

How to Gain an Edge in Your Investing

Anthony Summers, Director of Trading, The Oxford Club

Anthony Summers

People hate when I show them this chart.

Most investors are perpetually Pollyanna-ish. If the market's up, all is well.

Not me.

I deal in facts, figures, and plain truths - whether they make me comfortable or not.

That's not cynicism. It's realism. And realism pays.

SPONSORED

Warren Buffett Issues Cryptic Warning: Dollar “Going to Hell”

Is a dollar crash finally here? The world reserve currency is off to its worst start in half a century.

Warren Buffett has warned… “it’s going to hell.” And he may be right.

And a former Head of Currency Research at Morgan Stanley agrees: “The U.S. dollar could be vulnerable to a sudden, disorderly depreciation,” which could strike out of nowhere, like an avalanche.

At this pace, it will lose half its value in three years.

Meanwhile, stocks, gold, and bitcoin are hitting records – week after week.

One expert says these are all signs we’ve entered a new kind of bull market that’s “truly terrifying.”

For the full story, click here.

So when I say people hate this chart, it's because there's nothing comfortable about it.

The cyclically adjusted price-to-earnings (CAPE) ratio - also called P/E 10 - uses inflation-adjusted earnings averaged over the past decade. It smooths the cycle and gives a clearer long-term view of price versus earnings.

The chart below plots the CAPE of the S&P 500 in standard deviations from its long-term mean. In simple terms, it shows how far today's valuation sits from "normal."

Right now the reading is near three standard deviations above average.

Chart: More Proof Valuations Are High
View larger image
 

That is an extreme level by any historical yardstick. Readings that high show up only a tiny fraction of the time - roughly a few tenths of one percent.

For years, I've tried to alert investors to the market's rich valuation. But we live in a value-blind regime. Most folks only care about rising prices and earnings growth.

Those matter. But they're not everything.

When you focus on the right things - not just surface-level hype - you become a more principled, disciplined investor.

It doesn't mean you stop investing. It means you raise your standards.

SPONSORED

Yours Free! Top FIVE Dividend Stocks Right Now

Marc Lichtenfeld - income expert and author of Get Rich with Dividends - is giving away his Ultimate Dividend Package... completely free of charge!

You'll discover...

  • An "A"-rated, ultra-safe dividend stock with a huge 8% yield
  • Three of Marc's favorite "Extreme Dividend" stocks, which could supercharge your income
  • And finally, Marc's No. 1 dividend stock for a LIFETIME of income.

Click here to get the names and ticker symbols now... before the download link expires.

**NO CREDIT CARD REQUIRED!**

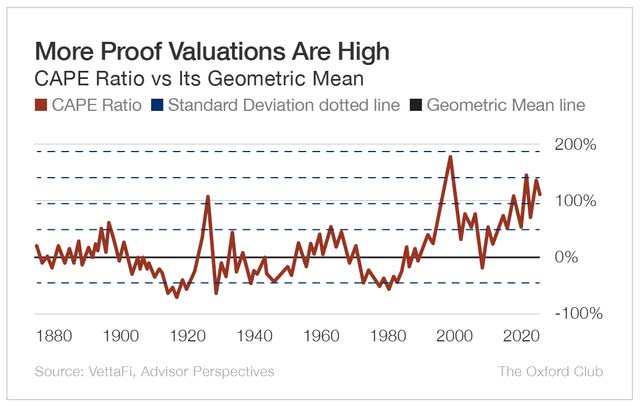
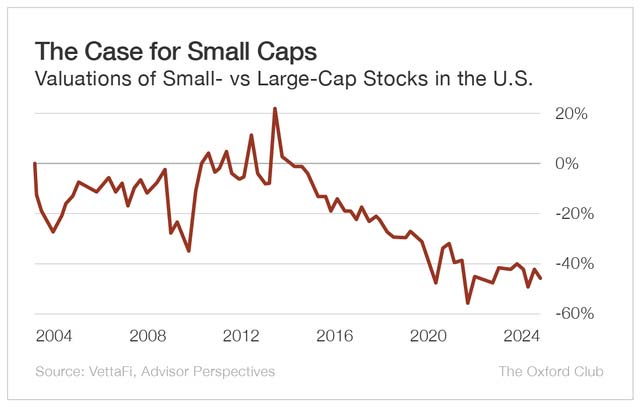
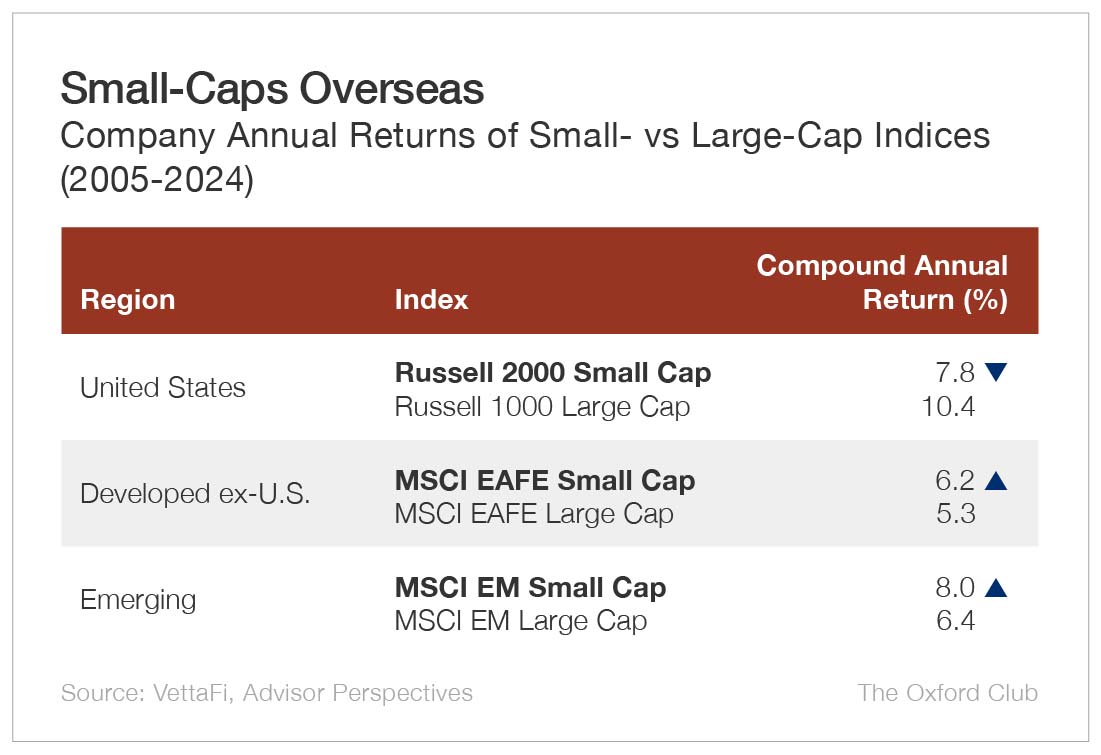
A market drenched in rich valuations isn't one to avoid. It's one that demands scrutiny and wisdom - the kind value investors have practiced for decades.

You weigh price against quality. You insist on a margin of safety. You accept that the crowd can be wrong for a long time.

Frankly, I like when most people ignore this. It gives me an edge. I look where others won't because they're busy chasing buzz. (My August 15 Value Meter column is a perfect example.)

Right now, the best values I see are in small caps. They trade at a clear discount to large caps.

Chart: The Case for Small Caps
View larger image
 

Over full market cycles, that's often where leadership flips and excess returns emerge. So long-term investors should be ecstatic about this.

History favors small caps on a global scale, which makes today a real opportunity.

But don't look only at the U.S.

Over the past 20 years, U.S. small caps have lagged large caps. But abroad, the story flips. In developed international markets - and in emerging markets - small caps have led.

Chart: Small-Caps Overseas
View larger image
 

Leadership rotates. Valuation gaps close. That is how cycles work.

The long-run data also suggests the U.S. gap is likely to narrow. Trends mean-revert, and current valuations help. (When you can buy durable small businesses at a discount while attention fixates on mega-cap winners, the odds tilt in your favor.)

That's why it's better to buy when small caps are out of favor - when focus is elsewhere and sentiment is sour. It's not about calling a top or a bottom. It's about treating price as a key part of the process and letting time do the heavy lifting.

Today, that discipline seems boring. Good. Boring sets you apart.

Take advantage of it.

Be excellent,

Anthony

Leave a Comment
How to Turn the AI Energy Crisis into BIG Profits - Click Here

Fed Cuts Rates, Gold Set to Surge. Learn How to Profit Now!

Alexander Green Discovers Tiny Cancer Detection Stock

SPONSORED

New AI Changes How To Profit From Earnings Season

A new AI tool
 

A brand-new AI tool is now able to help detect a powerful market force that has been studied by Harvard, the FED and even the SEC.

See how everyday Americans can unlock a new way to profit from earning season...

AND even outperform the market by as much as 1,700%.

See the details

Related Posts

There is no other posts in this category.

Post a Comment

Subscribe Our Newsletter